Coca Cola 2004 Annual Report Download - page 89
Download and view the complete annual report
Please find page 89 of the 2004 Coca Cola annual report below. You can navigate through the pages in the report by either clicking on the pages listed below, or by using the keyword search tool below to find specific information within the annual report.-
 1
1 -
2
-
3
-
4
-
5
-
6
-
7
-
8
-
9
-
10
-
11
-
12
-
13
-
14
-
15
-
16
-
17
-
18
-
19
-
20
-
21
-
22
-
23
-
24
-
25
-
26
-
27
-
28
-
29
-
30
-
31
-
32
-
33
-
34
-
35
-
36
-
37
-
38
-
39
-
40
-
41
-
42
-
43
-
44
-
45
-
46
-
47
-
48
-
49
-
50
-
51
-
52
-
53
-
54
-
55
-
56
-
57
-
58
-
59
-
60
-
61
-
62
-
63
-
64
-
65
-
66
-
67
-
68
-
69
-
70
-
71
-
72
-
73
-
74
-
75
-
76
-
77
-
78
-
 79
79 -
 80
80 -
 81
81 -
 82
82 -
 83
83 -
 84
84 -
 85
85 -
 86
86 -
 87
87 -
 88
88 -
 89
89 -
 90
90 -
 91
91 -
 92
92 -
 93
93 -
 94
94 -
 95
95 -
 96
96 -
 97
97 -
 98
98 -
 99
99 -
100
-
101
-
102
-
103
-
104
-
105
-
106
-
107
-
108
-
109
-
110
-
111
-
112
-
113
-
114
-
115
-
116
-
117
-
118
-
119
-
120
-
121
-
122
-
123
-
124
-
125
-
126
-
127
-
128
-
129
-
130
-
131
-
132
-
133
-
134
-
135
-
136
-
137
-
138
-
139
-
140
 |
 |

NOTES TO CONSOLIDATED FINANCIAL STATEMENTS
The Coca-Cola Company and Subsidiaries
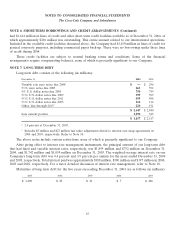
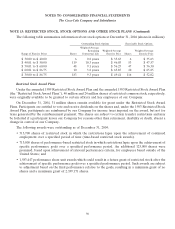
NOTE 9: FINANCIAL INSTRUMENTS (Continued)
On December 31, 2004 and 2003, these investments were included in the following captions (in millions):
Available- Held-to-
for-Sale Maturity
December 31, Securities Securities
2004
Cash and cash equivalents $ — $ 4,586
Current marketable securities 61 —
Cost method investments, principally bottling companies 229 —
Other assets 2—
$ 292 $ 4,586
Available- Held-to-
for-Sale Maturity
December 31, Securities Securities
2003
Cash and cash equivalents $ 118 $ 2,162
Current marketable securities 120 —
Cost method investments, principally bottling companies 185 —
Other assets 31
$ 426 $ 2,163
The contractual maturities of these investments as of December 31, 2004 were as follows (in millions):
Available-for-Sale Held-to-Maturity
Securities Securities
Fair Amortized Fair
Cost Value Cost Value
2005 $ — $ — $ 4,586 $ 4,586
2006-2009 — — — —
2010-2014 — — — —
After 2014 5 4 — —
Equity securities 144 288 — —
$ 149 $ 292 $ 4,586 $ 4,586
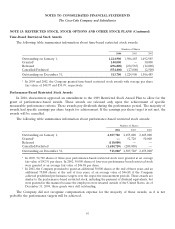
For the years ended December 31, 2004, 2003 and 2002, gross realized gains and losses on sales of
available-for-sale securities were not material. The cost of securities sold is based on the specific identification
method.
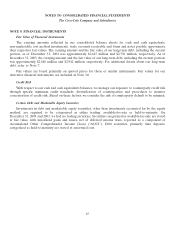
NOTE 10: HEDGING TRANSACTIONS AND DERIVATIVE FINANCIAL INSTRUMENTS
Our Company uses derivative financial instruments primarily to reduce our exposure to adverse fluctuations
in interest rates and foreign exchange rates and, to a lesser extent, in commodity prices and other market risks.
When entered into, the Company formally designates and documents the financial instrument as a hedge of a
specific underlying exposure, as well as the risk management objectives and strategies for undertaking the hedge
87