Coca Cola 2004 Annual Report Download - page 105
Download and view the complete annual report
Please find page 105 of the 2004 Coca Cola annual report below. You can navigate through the pages in the report by either clicking on the pages listed below, or by using the keyword search tool below to find specific information within the annual report.-
 1
1 -
2
-
3
-
4
-
5
-
6
-
7
-
8
-
9
-
10
-
11
-
12
-
13
-
14
-
15
-
16
-
17
-
18
-
19
-
20
-
21
-
22
-
23
-
24
-
25
-
26
-
27
-
28
-
29
-
30
-
31
-
32
-
33
-
34
-
35
-
36
-
37
-
38
-
39
-
40
-
41
-
42
-
43
-
44
-
45
-
46
-
47
-
48
-
49
-
50
-
51
-
52
-
53
-
54
-
55
-
56
-
57
-
58
-
59
-
60
-
61
-
62
-
63
-
64
-
65
-
66
-
67
-
68
-
69
-
70
-
71
-
72
-
73
-
74
-
75
-
76
-
77
-
78
-
79
-
80
-
81
-
82
-
83
-
84
-
85
-
86
-
87
-
88
-
89
-
90
-
91
-
92
-
93
-
94
-
 95
95 -
 96
96 -
 97
97 -
 98
98 -
 99
99 -
 100
100 -
 101
101 -
 102
102 -
 103
103 -
 104
104 -
 105
105 -
 106
106 -
 107
107 -
 108
108 -
 109
109 -
 110
110 -
 111
111 -
 112
112 -
 113
113 -
 114
114 -
 115
115 -
116
-
117
-
118
-
119
-
120
-
121
-
122
-
123
-
124
-
125
-
126
-
127
-
128
-
129
-
130
-
131
-
132
-
133
-
134
-
135
-
136
-
137
-
138
-
139
-
140
 |
 |

NOTES TO CONSOLIDATED FINANCIAL STATEMENTS
The Coca-Cola Company and Subsidiaries
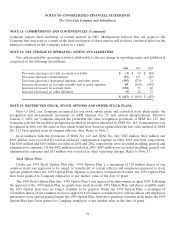
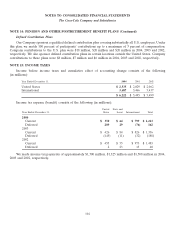
NOTE 14: PENSION AND OTHER POSTRETIREMENT BENEFIT PLANS (Continued)
Asset allocation targets promote optimal expected return and volatility characteristics given the long-term
time horizon for fulfilling the obligations of the pension plans. Selection of the targeted asset allocation for U.S.
plan assets was based upon a review of the expected return and risk characteristics of each asset class, as well as
the correlation of returns among asset classes.
Investment guidelines are established with each investment manager. These guidelines provide the
parameters within which the investment managers agree to operate, including criteria that determine eligible
and ineligible securities, diversification requirements and credit quality standards, where applicable. Unless
exceptions have been approved, investment managers are prohibited from buying or selling commodities, futures
or option contracts, as well as from short selling of securities. Furthermore, investment managers agree to obtain
written approval for deviations from stated investment style or guidelines.
As of December 31, 2004, no investment manager was responsible for more than 10 percent of total U.S.
plan assets. In addition, diversification requirements for each investment manager prevent a single security or
other investment from exceeding 10 percent, at historical cost, of the total U.S. plan assets.
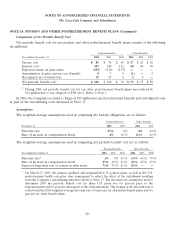
The expected long-term rate of return assumption on U.S. plan assets is based upon the target asset
allocation and is determined using forward-looking assumptions in the context of historical returns and
volatilities for each asset class, as well as correlations among asset classes. We evaluate the rate of return
assumption on an annual basis. The expected long-term rate of return assumption used in computing 2004 net
periodic pension cost for the U.S. plans was 8.5 percent. As of December 2004, the 10 year annualized return on
U.S. plan assets was 11.8 percent, the 15 year annualized return was 11.0 percent, and the annualized return
since inception was 12.9 percent.
Plan assets for our pension plans outside the United States are insignificant on an individual plan basis.
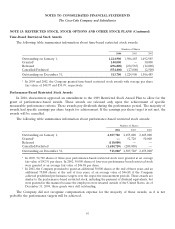
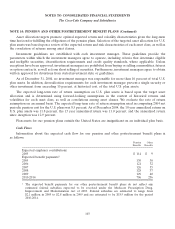
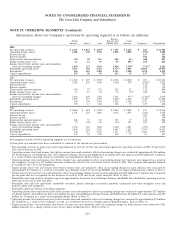
Cash Flows
Information about the expected cash flow for our pension and other postretirement benefit plans is
as follows:
Pension Other
Benefits Benefits
Expected employer contributions:
2005 $ 114 $ 9
Expected benefit payments1:
2005 130 30
2006 121 32
2007 126 35
2008 128 37
2009 129 40
2010-2014 706 236
1The expected benefit payments for our other postretirement benefit plans do not reflect any
estimated federal subsidies expected to be received under the Medicare Prescription Drug,
Improvement and Modernization Act of 2003. Federal subsidies are estimated to range from
$2.1 million in 2005 to $2.8 million in 2009 and are estimated to be $18.5 million for the period
2010-2014.
103