Coca Cola 2004 Annual Report Download - page 115
Download and view the complete annual report
Please find page 115 of the 2004 Coca Cola annual report below. You can navigate through the pages in the report by either clicking on the pages listed below, or by using the keyword search tool below to find specific information within the annual report.-
 1
1 -
2
-
3
-
4
-
5
-
6
-
7
-
8
-
9
-
10
-
11
-
12
-
13
-
14
-
15
-
16
-
17
-
18
-
19
-
20
-
21
-
22
-
23
-
24
-
25
-
26
-
27
-
28
-
29
-
30
-
31
-
32
-
33
-
34
-
35
-
36
-
37
-
38
-
39
-
40
-
41
-
42
-
43
-
44
-
45
-
46
-
47
-
48
-
49
-
50
-
51
-
52
-
53
-
54
-
55
-
56
-
57
-
58
-
59
-
60
-
61
-
62
-
63
-
64
-
65
-
66
-
67
-
68
-
69
-
70
-
71
-
72
-
73
-
74
-
75
-
76
-
77
-
78
-
79
-
80
-
81
-
82
-
83
-
84
-
85
-
86
-
87
-
88
-
89
-
90
-
91
-
92
-
93
-
94
-
95
-
96
-
97
-
98
-
99
-
100
-
101
-
102
-
103
-
104
-
 105
105 -
 106
106 -
 107
107 -
 108
108 -
 109
109 -
 110
110 -
 111
111 -
 112
112 -
 113
113 -
 114
114 -
 115
115 -
 116
116 -
 117
117 -
 118
118 -
 119
119 -
 120
120 -
 121
121 -
 122
122 -
 123
123 -
 124
124 -
 125
125 -
126
-
127
-
128
-
129
-
130
-
131
-
132
-
133
-
134
-
135
-
136
-
137
-
138
-
139
-
140
 |
 |

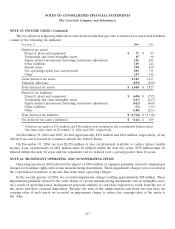
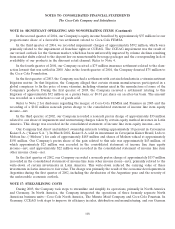
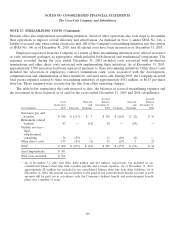
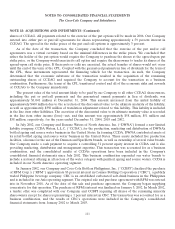
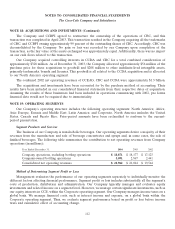
NOTES TO CONSOLIDATED FINANCIAL STATEMENTS
The Coca-Cola Company and Subsidiaries
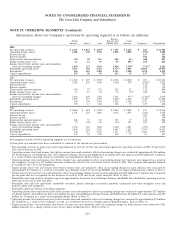
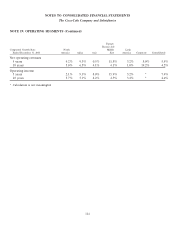
NOTE 19: OPERATING SEGMENTS (Continued)
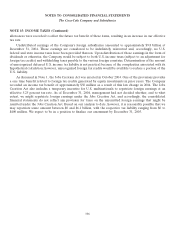
Information about our Company’s operations by operating segment is as follows (in millions):
Europe,
North Eurasia and Latin
America Africa Asia Middle East America Corporate Consolidated
2004
Net operating revenues $ 6,643 $ 1,067 $ 4,6911$ 7,195 $ 2,123 $ 243 $ 21,962
Operating income (loss)21,606 340 1,758 1,898 1,069 (973)35,698
Interest income 157 157
Interest expense 196 196
Depreciation and amortization 345 28 133 245 42 100 893
Equity income (loss)—net 11 12 83 85 185 4245 621
Income (loss) before income taxes and cumulative
effect of accounting change21,629 337 1,841 1,916 1,270 4(771)3,5 6,222
Identifiable operating assets 4,731 789 1,722 5,373 61,405 11,055 725,075
Investments8116 162 1,401 1,323 1,580 1,670 6,252
Capital expenditures 247 28 92 233 38 117 755
2003
Net operating revenues $ 6,344 $ 827 $ 5,0521$ 6,556 $ 2,042 $ 223 $ 21,044
Operating income (loss)91,282 249 1,690 1,908 970 (878)10 5,221
Interest income 176 176
Interest expense 178 178
Depreciation and amortization 305 27 124 230 52 112 850
Equity income (loss)—net 13 13 65 78 (5)11 242 406
Income (loss) before income taxes and cumulative
effect of accounting change91,326 249 1,740 1,921 975 11 (716)10 5,495
Identifiable operating assets 4,953 721 1,923 5,222 61,440 7,545 721,804
Investments8109 156 1,345 1,229 1,348 1,351 5,538
Capital expenditures 309 13 148 198 35 109 812
2002
Net operating revenues $ 6,264 $ 684 $ 5,0541$ 5,262 $ 2,089 $ 211 $ 19,564
Operating income (loss) 1,531 224 1,820 1,612 1,033 (762) 5,458
Interest income 209 209
Interest expense 199 199
Depreciation and amortization 266 37 133 193 57 120 806
Equity income (loss)—net 15 (25) 60 (18) 131 221 384
Income (loss) before income taxes and cumulative
effect of accounting change 1,552 187 1,848 1,540 1,081 (709) 5,499
Identifiable operating assets 4,999 565 2,370 4,481 61,205 5,795 719,415
Investments8142 115 1,150 1,211 1,352 1,021 4,991
Capital expenditures 334 18 209 162 37 91 851
Intercompany transfers between operating segments are not material.
Certain prior-year amounts have been reclassified to conform to the current-year presentation.
1Net operating revenues in Japan represented approximately 61 percent of total Asia operating segment net operating revenues in 2004, 67 percent in
2003 and 69 percent in 2002.
2Operating income (loss) and income (loss) before income taxes and cumulative effect of accounting change were reduced by approximately $18 million
for North America, $15 million for Asia, $377 million for Europe, Eurasia and Middle East, $6 million for Latin America and $64 million for Corporate
as a result of other operating charges recorded for asset impairments. Refer to Note 16.
3Operating income (loss) and income (loss) before income taxes and cumulative effect of accounting change for Corporate were impacted as a result of
the Company’s receipt of a $75 million insurance settlement related to the class-action lawsuit settled in 2000. The Company subsequently donated
$75 million to the Coca-Cola Foundation.
4Equity income (loss)—net and income (loss) before income taxes and cumulative effect of accounting change for Latin America were increased by
approximately $37 million as a result of a favorable tax settlement related to Coca-Cola FEMSA, one of our equity method investees. Refer to Note 2.
5Income (loss) before income taxes and cumulative effect of accounting change was increased by approximately $24 million for Corporate due to noncash
pre-tax gains that were recognized on the issuances of stock by CCE, one of our equity investees. Refer to Note 3.
6Identifiable operating assets in Germany represent approximately 46 percent of total Europe, Eurasia and Middle East identifiable operating assets in
2004 and 50 percent in 2003 and 2002.
7Principally cash and cash equivalents, marketable securities, finance subsidiary receivables, goodwill, trademarks and other intangible assets and
property, plant and equipment.
8Principally equity investments in bottling companies.
9Operating income (loss) and income (loss) before income taxes and cumulative effect of accounting change were reduced by approximately $273 million
for North America, $12 million for Africa, $18 million for Asia, $183 million for Europe, Eurasia and Middle East, $8 million for Latin America and $67
million for Corporate as a result of streamlining charges. Refer to Note 17.
10 Operating income (loss) and income (loss) before income taxes and cumulative effect of accounting change were increased by approximately $52 million
for Corporate as a result of the Company’s receipt of a settlement related to a vitamin antitrust litigation matter. Refer to Note 16.
11 Equity income (loss)—net and income (loss) before income taxes and cumulative effect of accounting change for Latin America were reduced by $102
million primarily for a charge related to one of our equity method investees. Refer to Note 2.
113