McDonalds 2008 Annual Report Download - page 29
Download and view the complete annual report
Please find page 29 of the 2008 McDonalds annual report below. You can navigate through the pages in the report by either clicking on the pages listed below, or by using the keyword search tool below to find specific information within the annual report.-
 1
1 -
2
-
3
-
4
-
5
-
6
-
7
-
8
-
9
-
10
-
11
-
12
-
13
-
14
-
15
-
16
-
17
-
18
-
 19
19 -
 20
20 -
 21
21 -
 22
22 -
 23
23 -
 24
24 -
 25
25 -
 26
26 -
 27
27 -
 28
28 -
 29
29 -
 30
30 -
 31
31 -
 32
32 -
 33
33 -
 34
34 -
 35
35 -
 36
36 -
 37
37 -
 38
38 -
 39
39 -
40
-
41
-
42
-
43
-
44
-
45
-
46
-
47
-
48
-
49
-
50
-
51
-
52
-
53
-
54
-
55
-
56
-
57
-
58
-
59
-
60
-
61
-
62
-
63
-
64
 |
 |

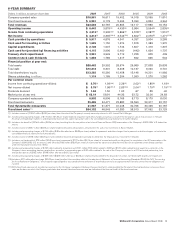
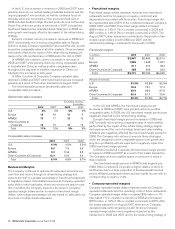
Impact of foreign currency translation on reported results
While changing foreign currencies affect reported results, McDonald’s mitigates exposures, where practical, by financing in local curren-
cies, hedging certain foreign-denominated cash flows, and purchasing goods and services in local currencies.
In 2008, foreign currency translation had a positive impact on consolidated operating results, driven by the stronger Euro and most
other currencies, partly offset by the weaker British Pound. However, in fourth quarter 2008, the U.S. Dollar strengthened significantly
against nearly every foreign currency, reducing the full year foreign currency benefit. Due to this strengthening, full year 2009 revenues
and operating income will likely be negatively impacted by foreign currency translation. In 2007, foreign currency translation had a pos-
itive impact on consolidated operating results, primarily driven by the stronger Euro, British Pound, Australian Dollar and Canadian Dollar.
In 2006, consolidated operating results were positively impacted by the stronger Euro, Canadian Dollar and British Pound.
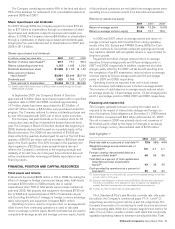
Impact of foreign currency translation on reported results
Reported amount Currency translation benefit/(cost)
In millions, except per share data 2008 2007 2006 2008 2007 2006
Revenues $23,522 $22,787 $20,895 $441 $988 $271
Company-operated margins 2,908 2,869 2,497 63 129 35
Franchised margins 5,731 5,036 4,435 120 179 23
Selling, general & administrative expenses 2,355 2,367 2,296 (21) (73) (19)
Operating income 6,443 3,879 4,433 163 230 29
Income from continuing operations 4,313 2,335 2,866 103 138 18
Net income 4,313 2,395 3,544 103 138 18
Income from continuing operations per common share—diluted 3.76 1.93 2.29 .09 .12 .02
Net income per common share—diluted 3.76 1.98 2.83 .09 .12 .01
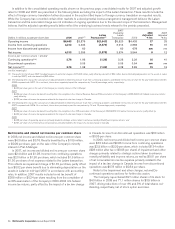
Revenues
The Company’s revenues consist of sales by Company-operated restaurants and fees from restaurants operated by franchisees. Rev-
enues from conventional franchised restaurants include rent and royalties based on a percent of sales along with minimum rent
payments, and initial fees. Revenues from restaurants licensed to affiliates and developmental licensees include a royalty based on a
percent of sales, and may include initial fees.
In both 2008 and 2007, consolidated revenue growth was driven by positive comparable sales as well as stronger foreign currencies.
Revenue growth in both years was negatively impacted by the Latam transaction. Upon completion of the Latam transaction in
August 2007, the Company receives royalties based on a percent of sales in these markets instead of a combination of Company-
operated sales and franchised rents and royalties. Revenue growth in 2008 was also partly offset by the impact of the refranchising
strategy in certain of the Company’s major markets, which resulted in a higher proportion of franchised restaurants compared with 2007.
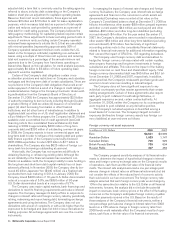
Revenues
Amount Increase/(decrease)
Increase/(decrease)
excluding currency
translation
Dollars in millions 2008 2007 2006 2008 2007 2008 2007
Company-operated sales:
U.S. $ 4,636 $ 4,682 $ 4,410 (1)% 6% (1)% 6%
Europe 7,424 6,817 5,885 916 67
APMEA 3,660 3,134 2,674 17 17 14 12
Other Countries & Corporate 841 1,978 2,433 (57) (19) (58) (23)
Total $16,561 $16,611 $15,402 –% 8% (2)% 3%
Franchised revenues:
U.S. $ 3,442 $ 3,224 $ 3,054 7% 6% 7% 6%
Europe 2,499 2,109 1,753 18 20 13 10
APMEA 571 465 379 23 22 20 14
Other Countries & Corporate 449 378 307 19 24 17 17
Total $ 6,961 $ 6,176 $ 5,493 13% 12% 10% 8%
Total revenues:
U.S. $ 8,078 $ 7,906 $ 7,464 2% 6% 2% 6%
Europe 9,923 8,926 7,638 11 17 78
APMEA 4,231 3,599 3,053 18 18 15 12
Other Countries & Corporate 1,290 2,356 2,740 (45) (14) (46) (18)
Total $23,522 $22,787 $20,895 3% 9% 1% 4%
McDonald’s Corporation Annual Report 2008 27