McDonalds 2008 Annual Report Download - page 36
Download and view the complete annual report
Please find page 36 of the 2008 McDonalds annual report below. You can navigate through the pages in the report by either clicking on the pages listed below, or by using the keyword search tool below to find specific information within the annual report.-
 1
1 -
2
-
3
-
4
-
5
-
6
-
7
-
8
-
9
-
10
-
11
-
12
-
13
-
14
-
15
-
16
-
17
-
18
-
19
-
20
-
21
-
22
-
23
-
24
-
25
-
 26
26 -
 27
27 -
 28
28 -
 29
29 -
 30
30 -
 31
31 -
 32
32 -
 33
33 -
 34
34 -
 35
35 -
 36
36 -
 37
37 -
 38
38 -
 39
39 -
 40
40 -
 41
41 -
 42
42 -
 43
43 -
 44
44 -
 45
45 -
 46
46 -
47
-
48
-
49
-
50
-
51
-
52
-
53
-
54
-
55
-
56
-
57
-
58
-
59
-
60
-
61
-
62
-
63
-
64
 |
 |

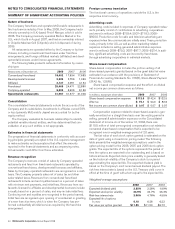
adopted retrospectively. We do not expect the adoption of SFAS
No. 160 to have a significant impact on our consolidated financial
statements.
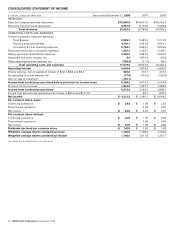
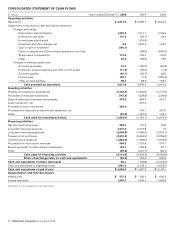
CASH FLOWS
The Company generates significant cash from its operations and
has substantial credit availability and capacity to fund operating
and discretionary spending such as capital expenditures, debt
repayments, dividends and share repurchases.
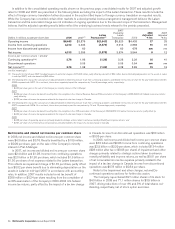
Cash provided by operations totaled $5.9 billion and exceeded
capital expenditures by $3.8 billion in 2008, while cash provided
by operations totaled $4.9 billion and exceeded capital
expenditures by $2.9 billion in 2007. In 2008, cash provided by
operations increased $1.0 billion or 21% compared to 2007 pri-
marily due to increased operating results and changes in working
capital, partly due to lower income tax payments and the receipt of
$143 million related to an IRS examination completed in 2007. In
2007, cash provided by operations increased $535 million com-
pared to 2006 primarily due to increased operating results and
lower income tax payments.
Cash used for investing activities totaled $1.6 billion in 2008,
an increase of $475 million compared with 2007. Proceeds from
certain asset sales were lower in 2008 (Pret A Manger) than 2007
(Latam and Boston Market). In addition, capital expenditures
increased $189 million in 2008, primarily driven by increases in
Europe and APMEA, partly offset by the elimination of capital
expenditures as a result of the Latam transaction. The increase in
cash used for investing activities was partly offset by higher pro-
ceeds from the sales of restaurant businesses and property and
lower expenditures on purchases of restaurant businesses in con-
junction with our overall refranchising strategy. Cash used for
investing activities totaled $1.2 billion in 2007, a decrease of
$124 million compared with 2006, primarily due to net proceeds
received from the Latam transaction and the sale of Boston Mar-
ket in 2007, partly offset by higher capital expenditures.
Cash used for financing activities totaled $4.1 billion in 2008,
an increase of $118 million compared with 2007. Financing activ-
ities in 2008 reflected lower proceeds from stock option exercises,
mostly offset by higher net debt issuances. In 2007, cash used for
financing activities totaled $4.0 billion, a decrease of $1.5 billion
compared to 2006, primarily due to higher net debt issuances,
partly offset by higher treasury stock purchases and an increase in
the common stock dividend.
As a result of the above activity, the Company’s cash and equiv-
alents balance increased $82 million in 2008 to $2.1 billion,
compared with a decrease of $147 million in 2007. In addition to
cash and equivalents on hand and cash provided by operations, the
Company can meet short-term funding needs through its con-
tinued access to commercial paper borrowings and line of credit
agreements.
Restaurant development and capital expenditures
In 2008, the Company opened 918 traditional restaurants and 77
satellite restaurants (small, limited-menu restaurants for which the
land and building are generally leased), and closed 209 traditional
restaurants and 196 satellite restaurants. In 2007, the Company
opened 743 traditional restaurants and 93 satellite restaurants,
and closed 240 traditional restaurants and 265 satellite restau-
rants. About 60% of restaurant openings and more than 75% of
restaurant closings occurred in the major markets in both years.
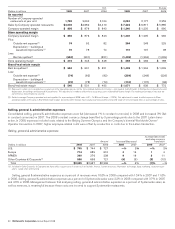
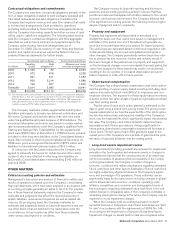
Systemwide restaurants at year end(1)
2008 2007 2006
U.S. 13,918 13,862 13,774
Europe 6,628 6,480 6,403
APMEA 8,255 7,938 7,822
Other Countries & Corporate 3,166 3,097 3,047
Total 31,967 31,377 31,046
(1) Includes satellite units at December 31, 2008, 2007 and 2006 as follows: U.S.–
1,169, 1,233, 1,254; Europe–226, 214, 201; APMEA (primarily Japan)–1,379,
1,454, 1,640; Other Countries & Corporate–447, 439, 417.
In 2009, the Company expects to open about 950 traditional
restaurants and 50 satellite restaurants and close about 200 tradi-
tional restaurants and 150 satellite restaurants. About 60% of total
openings and 70% of total closings will be in major markets.
Approximately 65% of Company-operated restaurants and
about 80% of franchised restaurants were located in the major
markets at the end of 2008. Franchisees operated 80% of the
restaurants at year-end 2008.
Capital expenditures increased $189 million or 10% in 2008
and $205 million or 12% in 2007. The increases in capital
expenditures in both years were primarily due to higher investment
in new restaurants — in Europe and APMEA in 2008 and in
Europe and the U.S. in 2007. Capital expenditures reflected the
Company’s commitment to growing sales at existing restaurants,
including reinvestment initiatives such as reimaging in many mar-
kets around the world in both years and the Combined Beverage
Business in the U.S. in 2008. Capital expenditures related to dis-
continued operations were $10 million and $82 million in 2007
and 2006, respectively. The expenditures in 2007 primarily related
to investment in existing Boston Market restaurants and
expenditures in 2006 primarily related to new Chipotle restaurants.
Capital expenditures invested in major markets, excluding
Japan, represented over 70% of the total in 2008, 2007 and
2006. Japan is accounted for under the equity method, and
accordingly its capital expenditures are not included in con-
solidated amounts.
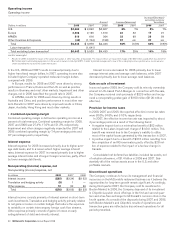
Capital expenditures
In millions 2008 2007 2006
New restaurants $ 897 $ 687 $ 530
Existing restaurants 1,152 1,158 1,075
Other(1) 87 102 137
Total capital expenditures $ 2,136 $ 1,947 $ 1,742
Total assets $28,462 $29,392 $28,974
(1) Primarily corporate equipment and other office related expenditures.
New restaurant investments in all years were concentrated in
markets with acceptable returns or opportunities for long-term
growth. Average development costs vary widely by market depend-
ing on the types of restaurants built and the real estate and
construction costs within each market. These costs, which include
land, buildings and equipment, are managed through the use of
optimally sized restaurants, construction and design efficiencies
and leveraging best practices. In addition, foreign currency fluctua-
tions affect average development costs. Although the Company is
not responsible for all costs for every restaurant opened, total
development costs (consisting of land, buildings and equipment)
for new traditional McDonald’s restaurants in the U.S. averaged
approximately $2.6 million in 2008.
34 McDonald’s Corporation Annual Report 2008