McDonalds 2008 Annual Report Download - page 46
Download and view the complete annual report
Please find page 46 of the 2008 McDonalds annual report below. You can navigate through the pages in the report by either clicking on the pages listed below, or by using the keyword search tool below to find specific information within the annual report.-
 1
1 -
2
-
3
-
4
-
5
-
6
-
7
-
8
-
9
-
10
-
11
-
12
-
13
-
14
-
15
-
16
-
17
-
18
-
19
-
20
-
21
-
22
-
23
-
24
-
25
-
26
-
27
-
28
-
29
-
30
-
31
-
32
-
33
-
34
-
35
-
 36
36 -
 37
37 -
 38
38 -
 39
39 -
 40
40 -
 41
41 -
 42
42 -
 43
43 -
 44
44 -
 45
45 -
 46
46 -
 47
47 -
 48
48 -
 49
49 -
 50
50 -
 51
51 -
 52
52 -
 53
53 -
 54
54 -
 55
55 -
 56
56 -
57
-
58
-
59
-
60
-
61
-
62
-
63
-
64
 |
 |

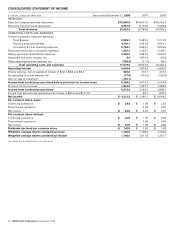
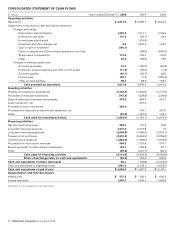
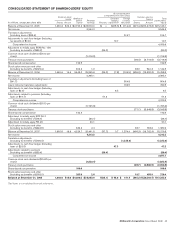
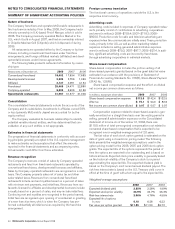
NOTES TO CONSOLIDATED FINANCIAL STATEMENTS
SUMMARY OF SIGNIFICANT ACCOUNTING POLICIES
Nature of business
The Company franchises and operates McDonald’s restaurants in
the food service industry. Prior to May 2008, the Company had a
minority ownership in U.K.-based Pret A Manger, which it sold in
2008. The Company previously operated Boston Market in the
U.S., which it sold in August 2007, and had an ownership interest
in Chipotle Mexican Grill (Chipotle), which it disposed of during
2006.
All restaurants are operated either by the Company or by fran-
chisees, including conventional franchisees under franchise
arrangements, and foreign affiliated markets (affiliates) and devel-
opmental licensees under license agreements.
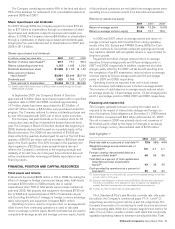
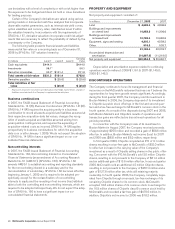
The following table presents restaurant information by owner-
ship type:
Restaurants at December 31, 2008 2007 2006
Conventional franchised 18,402 17,634 17,683
Developmental licensed 2,926 2,756 1,063
Affiliated 4,137 4,081 4,134
Franchised 25,465 24,471 22,880
Company-operated 6,502 6,906 8,166
Systemwide restaurants 31,967 31,377 31,046
Consolidation
The consolidated financial statements include the accounts of the
Company and its subsidiaries. Investments in affiliates owned 50%
or less (primarily McDonald’s Japan) are accounted for by the
equity method.
The Company evaluates its business relationships to identify
potential variable interest entities, and has determined that con-
solidation of any such entities is not appropriate.
Estimates in financial statements
The preparation of financial statements in conformity with account-
ing principles generally accepted in the U.S. requires management
to make estimates and assumptions that affect the amounts
reported in the financial statements and accompanying notes.
Actual results could differ from those estimates.
Revenue recognition
The Company’s revenues consist of sales by Company-operated
restaurants and fees from franchised restaurants operated by
conventional franchisees, developmental licensees and affiliates.
Sales by Company-operated restaurants are recognized on a cash
basis. The Company presents sales net of sales tax and other
sales-related taxes. Revenues from conventional franchised
restaurants include rent and royalties based on a percent of sales
with minimum rent payments, and initial fees. Revenues from res-
taurants licensed to affiliates and developmental licensees include
a royalty based on a percent of sales, and may include initial fees.
Continuing rent and royalties are recognized in the period earned.
Initial fees are recognized upon opening of a restaurant or granting
of a new franchise term, which is when the Company has per-
formed substantially all initial services required by the franchise
arrangement.
Foreign currency translation
The functional currency of operations outside the U.S. is the
respective local currency.
Advertising costs
Advertising costs included in expenses of Company-operated restau-
rants primarily consist of contributions to advertising cooperatives
and were (in millions): 2008–$703.4; 2007–$718.3; 2006–
$669.8. Production costs for radio and television advertising are
expensed when the commercials are initially aired. These production
costs, primarily in the U.S., as well as other marketing-related
expenses included in selling, general & administrative expenses
were (in millions): 2008–$79.2; 2007–$87.7; 2006–$97.4. In addi-
tion, significant advertising costs are incurred by franchisees
through advertising cooperatives in individual markets.
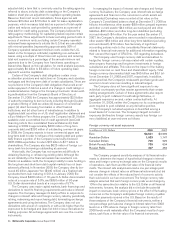
Share-based compensation
Share-based compensation includes the portion vesting of all
share-based payments granted based on the grant date fair value
estimated in accordance with the provisions of Statement of
Financial Accounting Standards No. 123(R), Share-Based Payment
(SFAS No. 123(R)).
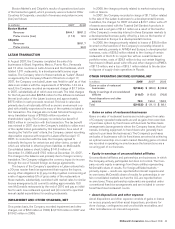
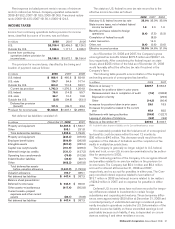
Share-based compensation expense and the effect on diluted
net income per common share were as follows:
In millions, except per share data 2008 2007 2006
Share-based compensation expense $112.5 $142.4 $122.5
After tax $ 75.1 $ 94.9 $ 82.6
Net income per common share-diluted $ 0.07 $ 0.07 $ 0.07
Compensation expense related to share-based awards is gen-
erally amortized on a straight-line basis over the vesting period in
selling, general & administrative expenses on the Consolidated
statement of income. As of December 31, 2008, there was
$115.5 million of total unrecognized compensation cost related to
nonvested share-based compensation that is expected to be
recognized over a weighted-average period of 2.0 years.
The fair value of each stock option granted is estimated on the
date of grant using a closed-form pricing model. The following
table presents the weighted-average assumptions used in the
option pricing model for the 2008, 2007 and 2006 stock option
grants. The expected life of the options represents the period of
time the options are expected to be outstanding and is based on
historical trends. Expected stock price volatility is generally based
on the historical volatility of the Company’s stock for a period
approximating the expected life. The expected dividend yield is
based on the Company’s most recent annual dividend payout. The
risk-free interest rate is based on the U.S. Treasury yield curve in
effect at the time of grant with a term equal to the expected life.
Weighted-average assumptions
2008 2007 2006
Expected dividend yield 2.55% 2.26% 1.99%
Expected stock price volatility 24.9% 24.7% 26.4%
Risk-free interest rate 2.96% 4.76% 4.55%
Expected life of options
In years 6.18 6.26 6.22
Fair value per option granted $11.85 $11.59 $9.72
44 McDonald’s Corporation Annual Report 2008