McDonalds 2008 Annual Report Download - page 50
Download and view the complete annual report
Please find page 50 of the 2008 McDonalds annual report below. You can navigate through the pages in the report by either clicking on the pages listed below, or by using the keyword search tool below to find specific information within the annual report.-
 1
1 -
2
-
3
-
4
-
5
-
6
-
7
-
8
-
9
-
10
-
11
-
12
-
13
-
14
-
15
-
16
-
17
-
18
-
19
-
20
-
21
-
22
-
23
-
24
-
25
-
26
-
27
-
28
-
29
-
30
-
31
-
32
-
33
-
34
-
35
-
36
-
37
-
38
-
39
-
 40
40 -
 41
41 -
 42
42 -
 43
43 -
 44
44 -
 45
45 -
 46
46 -
 47
47 -
 48
48 -
 49
49 -
 50
50 -
 51
51 -
 52
52 -
 53
53 -
 54
54 -
 55
55 -
 56
56 -
 57
57 -
 58
58 -
 59
59 -
 60
60 -
61
-
62
-
63
-
64
 |
 |

use derivatives with a level of complexity or with a risk higher than
the exposures to be hedged and does not hold or issue derivatives
for trading purposes.
Certain of the Company’s derivatives are valued using various
pricing models or discounted cash flow analyses that incorporate
observable market parameters, such as interest rate yield curves,
option volatilities and currency rates, classified as Level 2 within
the valuation hierarchy. In accordance with the requirements of
SFAS No. 157, derivative valuations incorporate credit risk adjust-
ments that are necessary to reflect the probability of default by the
counterparty or the Company.
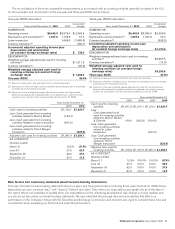
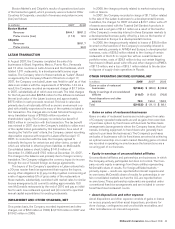
The following table presents financial assets and liabilities
measured at fair value on a recurring basis as of December 31,
2008 by SFAS No. 157 valuation hierarchy:
In millions Level 1 Level 2 Level 3 Carrying
Value
Cash equivalents $444.9 $444.9
Investments 96.1* 96.1
Derivative receivables 90.2* $131.4 221.6
Total assets at fair value $631.2 $131.4 $762.6
Derivative payables $ (25.6) $ (25.6)
Total liabilities at fair
value $ (25.6) $ (25.6)
* Represents long-term investments and derivatives that hedge market-driven changes in
liabilities associated with the Company’s supplemental benefit plans.
Business combinations
In 2007, the FASB issued Statement of Financial Accounting
Standards No. 141(R), Business Combinations (SFAS No. 141(R)).
SFAS No. 141(R) requires the acquiring entity in a business
combination to record all assets acquired and liabilities assumed at
their respective acquisition-date fair values, changes the recog-
nition of assets acquired and liabilities assumed arising from
preacquisition contingencies, and requires the expensing of
acquisition-related costs as incurred. SFAS No. 141(R) applies
prospectively to business combinations for which the acquisition
date is on or after January 1, 2009. We do not expect the adoption
of SFAS No. 141(R) to have a significant impact on our con-
solidated financial statements.
Noncontrolling interests
In 2007, the FASB issued Statement of Financial Accounting
Standards No. 160, Noncontrolling Interests in Consolidated
Financial Statements (an amendment of Accounting Research
Bulletin No. 51 (ARB 51)) (SFAS No. 160). SFAS No. 160
amends ARB 51 to establish accounting and reporting standards
for the noncontrolling interest in a subsidiary and for the
deconsolidation of a subsidiary. SFAS No. 160 becomes effective
beginning January 1, 2009 and is required to be adopted pro-
spectively, except for the reclassification of noncontrolling
interests to equity and the recasting of net income (loss) attribut-
able to both the controlling and noncontrolling interests, which are
required to be adopted retrospectively. We do not expect the adop-
tion of SFAS No. 160 to have a significant impact on our
consolidated financial statements.
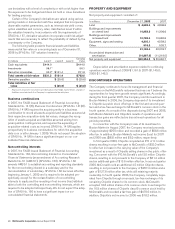
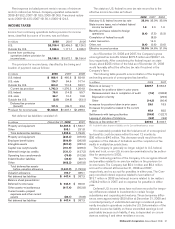
PROPERTY AND EQUIPMENT
Net property and equipment consisted of:
In millions December 31, 2008 2007
Land $ 4,689.6 $ 4,836.6
Buildings and improvements
on owned land 10,952.3 11,306.6
Buildings and improvements
on leased land 10,788.6 10,962.6
Equipment, signs and seating 4,205.1 4,558.2
Other 516.8 539.7
31,152.4 32,203.7
Accumulated depreciation and
amortization (10,897.9) (11,219.0)
Net property and equipment $20,254.5 $ 20,984.7
Depreciation and amortization expense related to continuing
operations was (in millions): 2008-$1,161.6; 2007-$1,145.0;
2006-$1,146.3.
DISCONTINUED OPERATIONS
The Company continues to focus its management and financial
resources on the McDonald’s restaurant business as it believes the
opportunities for long-term growth remain significant. Accordingly,
during the third quarter 2007, the Company sold its investment in
Boston Market. In 2006, the Company disposed of its investment
in Chipotle via public stock offerings in the first and second quar-
ters and a tax-free exchange for McDonald’s common stock in the
fourth quarter. As a result of the disposals during 2007 and 2006,
both Boston Market’s and Chipotle’s results of operations and
transaction gains are reflected as discontinued operations for all
periods presented.
In connection with the Company’s sale of its investment in
Boston Market in August 2007, the Company received proceeds
of approximately $250 million and recorded a gain of $68.6 million
after tax. In addition, Boston Market’s net income (loss) for 2007
and 2006 was ($8.5) million and $6.9 million, respectively.
In first quarter 2006, Chipotle completed an IPO of 6.1 million
shares resulting in a tax-free gain to McDonald’s of $32.0 million
to reflect an increase in the carrying value of the Company’s
investment as a result of Chipotle selling shares in the public offer-
ing. Concurrent with the IPO, McDonald’s sold 3.0 million Chipotle
shares, resulting in net proceeds to the Company of $61.4 million
and an additional gain of $13.6 million after tax. In second quarter
2006, McDonald’s sold an additional 4.5 million Chipotle shares,
resulting in net proceeds to the Company of $267.4 million and a
gain of $127.8 million after tax, while still retaining majority
ownership. In fourth quarter 2006, the Company completely sepa-
rated from Chipotle through a noncash, tax-free exchange of its
remaining Chipotle shares for its common stock. McDonald’s
accepted 18.6 million shares of its common stock in exchange for
the 16.5 million shares of Chipotle class B common stock held by
McDonald’s and recorded a tax-free gain of $479.6 million. In
addition, Chipotle’s net income for 2006 was $18.2 million.
48 McDonald’s Corporation Annual Report 2008