McDonalds 2008 Annual Report Download - page 54
Download and view the complete annual report
Please find page 54 of the 2008 McDonalds annual report below. You can navigate through the pages in the report by either clicking on the pages listed below, or by using the keyword search tool below to find specific information within the annual report.-
 1
1 -
2
-
3
-
4
-
5
-
6
-
7
-
8
-
9
-
10
-
11
-
12
-
13
-
14
-
15
-
16
-
17
-
18
-
19
-
20
-
21
-
22
-
23
-
24
-
25
-
26
-
27
-
28
-
29
-
30
-
31
-
32
-
33
-
34
-
35
-
36
-
37
-
38
-
39
-
40
-
41
-
42
-
43
-
 44
44 -
 45
45 -
 46
46 -
 47
47 -
 48
48 -
 49
49 -
 50
50 -
 51
51 -
 52
52 -
 53
53 -
 54
54 -
 55
55 -
 56
56 -
 57
57 -
 58
58 -
 59
59 -
 60
60 -
 61
61 -
 62
62 -
 63
63 -
 64
64
 |
 |

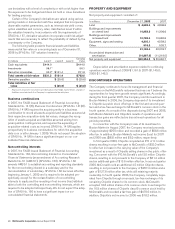
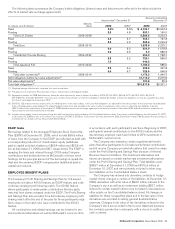
SEGMENT AND GEOGRAPHIC INFORMATION
The Company operates in the food service industry and manages
its business as distinct geographic segments.
All intercompany revenues and expenses are eliminated in
computing revenues and operating income. Royalties and other
payments from subsidiaries outside the U.S. were (in millions):
2008–$1,229.8; 2007–$1,116.7; 2006–$945.4.
Corporate general & administrative expenses are included in
Other Countries & Corporate and consist of home office support
costs in areas such as facilities, finance, human resources,
information technology, legal, marketing, restaurant operations,
supply chain and training. Corporate assets include corporate cash
and equivalents, asset portions of financial instruments and home
office facilities.
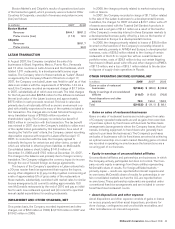
In millions 2008 2007 2006
U.S. $ 8,078.3 $ 7,905.5 $ 7,464.1
Europe 9,922.9 8,926.2 7,637.7
APMEA 4,230.8 3,598.9 3,053.5
Other Countries &
Corporate 1,290.4 2,356.0 2,739.9
Total revenues $23,522.4 $22,786.6 $20,895.2
U.S. $ 3,059.7 $ 2,841.9 $ 2,657.0
Europe 2,608.0 2,125.4 1,610.2
APMEA 818.8 616.3 364.4
Other Countries &
Corporate (43.6) (1,704.6) (198.6)
Total operating income $ 6,442.9 $ 3,879.0(1) $ 4,433.0(2)
U.S. $10,356.7 $10,031.8 $ 9,477.4
Europe 10,532.7 11,380.4 10,413.9
APMEA 4,074.6 4,145.3 3,727.6
Other Countries &
Corporate 3,497.5 3,834.2 3,529.4
Businesses held for sale 1,631.5
Discontinued operations 194.7
Total assets $28,461.5 $29,391.7 $28,974.5
U.S. $ 837.4 $ 805.1 $ 774.3
Europe 864.1 687.4 504.9
APMEA 360.6 302.8 208.1
Other Countries &
Corporate 73.6 97.3 85.4
Businesses held for sale 43.7 87.0
Discontinued operations 10.3 82.2
Total capital
expenditures $ 2,135.7 $ 1,946.6 $ 1,741.9
U.S. $ 400.9 $ 402.7 $ 390.5
Europe 506.3 473.3 436.4
APMEA 193.4 178.1 171.8
Other Countries &
Corporate 107.2 112.6 110.4
Businesses held for sale 26.1 81.8
Discontinued operations 21.3 59.0
Total depreciation and
amortization $ 1,207.8 $ 1,214.1 $ 1,249.9
See Impairment and other charges, net note for further discussion of the following items:
(1) Includes $1.7 billion of charges/(credits) (Other Countries & Corporate–$1,681.0 mil-
lion and Europe–($10.7) million) primarily related to the Latam transaction.
(2) Includes $134.2 million of charges (Europe–$61.9 million; APMEA–$48.2 million and
Other Countries & Corporate–$24.1 million) primarily related to losses incurred on the
transfers of the Company’s ownership interest in certain markets to developmental
licensees and certain other strategic actions.
Total long-lived assets, primarily property and equipment, were
(in millions)—Consolidated: 2008–$24,385.8; 2007–$25,186.9;
2006–$23,185.3. U.S. based: 2008–$10,389.7;
2007–$10,043.7; 2006–$9,421.6.
DEBT FINANCING
Line of credit agreements
At December 31, 2008, the Company had a $1.3 billion line of
credit agreement expiring in 2012 with fees of 0.05% per annum
on the total commitment, which remained unused. Fees and inter-
est rates on this line are based on the Company’s long-term credit
rating assigned by Moody’s and Standard & Poor’s. In addition,
certain subsidiaries outside the U.S. had unused lines of credit
totaling $783.2 million at December 31, 2008; these uncommitted
lines of credit were principally short-term and denominated in vari-
ous currencies at local market rates of interest.
As a result of the Company’s decision to repatriate certain for-
eign earnings under the Homeland Investment Act (HIA), certain
wholly-owned subsidiaries outside the U.S. entered into a multi-
currency term loan facility totaling $2.9 billion in 2005. The facility
expired in 2008, and the $1.8 billion in outstanding borrowings at
December 31, 2007 were repaid during 2008.
The weighted-average interest rate of short-term borrowings
was 4.7% at December 31, 2008 (based on $232.1 million of
commercial paper and $625.4 million of foreign currency bank line
borrowings) and 5.9% at December 31, 2007 (based on
$625.8 million of foreign currency bank line borrowings).
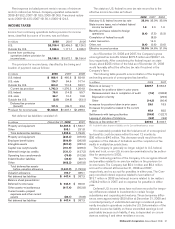
Fair values
At December 31, 2008, the fair value of the Company’s debt obli-
gations was estimated at $10.3 billion, compared to a carrying
amount of $10.2 billion. This fair value was estimated using various
pricing models or discounted cash flow analyses that incorporated
quoted market prices and are similar to Level 2 inputs within the
SFAS No. 157 valuation hierarchy. The Company has no current
plans to retire a significant amount of its debt prior to maturity.
The carrying amounts for both cash and equivalents and notes
receivable approximate fair value. No fair value was estimated for
non-interest bearing security deposits by franchisees, because
these deposits are an integral part of the overall franchise
arrangements.
Debt obligations
The Company has incurred debt obligations principally through
public and private offerings and bank loans. There are no provi-
sions in the Company’s debt obligations that would accelerate
repayment of debt as a result of a change in credit ratings or a
material adverse change in the Company’s business. Certain of the
Company’s debt obligations contain cross-acceleration provisions,
and restrictions on Company and subsidiary mortgages and the
long-term debt of certain subsidiaries. Under certain agreements,
the Company has the option to retire debt prior to maturity, either
at par or at a premium over par.
In January 2009, the Company issued $400 million of 10-year
U.S. Dollar-denominated notes at a coupon rate of 5.0%, and
$350 million of 30-year U.S. Dollar-denominated bonds at a cou-
pon rate of 5.7%.
52 McDonald’s Corporation Annual Report 2008