McDonalds 2008 Annual Report Download - page 37
Download and view the complete annual report
Please find page 37 of the 2008 McDonalds annual report below. You can navigate through the pages in the report by either clicking on the pages listed below, or by using the keyword search tool below to find specific information within the annual report.-
 1
1 -
2
-
3
-
4
-
5
-
6
-
7
-
8
-
9
-
10
-
11
-
12
-
13
-
14
-
15
-
16
-
17
-
18
-
19
-
20
-
21
-
22
-
23
-
24
-
25
-
26
-
 27
27 -
 28
28 -
 29
29 -
 30
30 -
 31
31 -
 32
32 -
 33
33 -
 34
34 -
 35
35 -
 36
36 -
 37
37 -
 38
38 -
 39
39 -
 40
40 -
 41
41 -
 42
42 -
 43
43 -
 44
44 -
 45
45 -
 46
46 -
 47
47 -
48
-
49
-
50
-
51
-
52
-
53
-
54
-
55
-
56
-
57
-
58
-
59
-
60
-
61
-
62
-
63
-
64
 |
 |

The Company owned approximately 45% of the land and about
70% of the buildings for restaurants in its consolidated markets at
year-end 2008 and 2007.
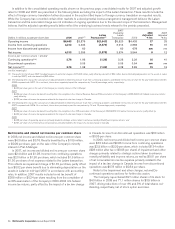
Share repurchases and dividends
For 2007 through 2009, the Company expects to return $15 bil-
lion to $17 billion to shareholders through a combination of share
repurchases and dividends, subject to business and market con-
ditions. In 2008, the Company returned $5.8 billion to shareholders
through a combination of shares repurchased and dividends paid,
bringing the two-year total returned to shareholders for 2007 and
2008 to $11.5 billion.
Shares repurchased and dividends
In millions, except per share data 2008 2007 2006
Number of shares repurchased(1) 69.7 77.1 98.4
Shares outstanding at year end 1,115 1,165 1,204
Dividends declared per share $1.625 $ 1.50 $ 1.00
Dollar amount of shares
repurchased(1) $3,981 $3,949 $3,719
Dividends paid 1,823 1,766 1,217
Total returned to shareholders $5,804 $5,715 $4,936
(1) 2006 included 18.6 million shares or $743.6 million acquired through the October
2006 Chipotle exchange.
In September 2007, the Company’s Board of Directors
approved a $10 billion share repurchase program with no specified
expiration date. In 2007 and 2008 combined, approximately
147 million shares have been repurchased for $7.9 billion, of
which 97 million shares or $5.6 billion were purchased under this
program. The Company reduced its shares outstanding at year end
by over 4% compared with 2007, net of stock option exercises.
The Company has paid dividends on its common stock for 33
consecutive years and has increased the dividend amount every
year. The Company’s Board of Directors decided that beginning in
2008, dividends declared will be paid on a quarterly basis, at the
Board’s discretion. The 2008 full year dividend of $1.625 per
share reflects the quarterly dividend paid for each of the first three
quarters of $0.375 per share, with an increase to $0.50 per share
paid in the fourth quarter. This 33% increase in the quarterly divi-
dend equates to a $2.00 per share annual dividend rate and
reflects the Company’s confidence in the ongoing strength and
reliability of its cash flow. As in the past, future dividend amounts
will be considered after reviewing profitability expectations and
financing needs.
FINANCIAL POSITION AND CAPITAL RESOURCES
Total assets and returns
Total assets decreased $930 million or 3% in 2008. Excluding the
effect of changes in foreign currency exchange rates, total assets
increased $784 million in 2008 primarily due to capital
expenditures. Over 70% of total assets were in major markets at
year-end 2008. Net property and equipment decreased $730 mil-
lion in 2008 and represented about 70% of total assets at year
end. Excluding the effect of changes in foreign currency exchange
rates, net property and equipment increased $681 million.
Operating income is used to compute return on average assets,
while income from continuing operations is used to calculate
return on average common equity. Month-end balances are used to
compute both average assets and average common equity. Assets
of discontinued operations are excluded from average assets since
operating income excludes results from discontinued operations.
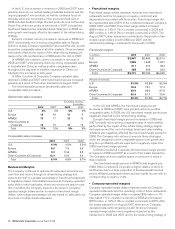
Returns on assets and equity
2008 2007 2006
Return on average assets 21.8% 13.2% 15.0%
Return on average common equity 30.6 15.1 18.4
In 2008 and 2007, return on average assets and return on
average common equity both benefited from strong operating
results in the U.S., Europe and APMEA. During 2009, the Com-
pany will continue to concentrate restaurant openings and invest
new capital in markets with acceptable returns or opportunities for
long-term growth.
Impairment and other charges reduced return on average
assets by 5.4 percentage points and 0.4 percentage points in
2007 and 2006, respectively. In addition, impairment and other
charges, partly offset by the 2007 net tax benefit resulting from
the completion of an IRS examination, reduced return on average
common equity by 8.5 percentage points and 0.6 percentage
points in 2007 and 2006, respectively.
Operating income, as reported, does not include interest
income; however, cash balances are included in average assets.
The inclusion of cash balances in average assets reduced return
on average assets by 1.9 percentage points, 1.3 percentage points
and 2.1 percentage points in 2008, 2007 and 2006, respectively.
Financing and market risk
The Company generally borrows on a long-term basis and is
exposed to the impact of interest rate changes and foreign cur-
rency fluctuations. Debt obligations at December 31, 2008 totaled
$10.2 billion, compared with $9.3 billion at December 31, 2007.
The net increase in 2008 was primarily due to net issuances of
$1.0 billion, partly offset by the impact of changes in exchange
rates on foreign currency denominated debt of $155 million.
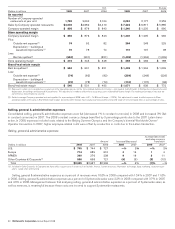
Debt highlights (1)
2008 2007 2006
Fixed-rate debt as a percent of total debt(2,3) 72% 58% 49%
Weighted-average annual interest rate of
total debt(3) 5.0 4.7 4.1
Foreign currency-denominated debt as a
percent of total debt(2) 45 66 80
Total debt as a percent of total capitalization
(total debt and total shareholders’
equity)(2) 43 38 35
Cash provided by operations as a percent of
total debt(2) 59 53 52
(1) All percentages are as of December 31, except for the weighted-average annual inter-
est rate, which is for the year.
(2) Based on debt obligations before the effect of SFAS No. 133 fair value adjustments.
This effect is excluded as these adjustments have no impact on the obligation at
maturity. See Debt financing note to the consolidated financial statements.
(3) Includes the effect of interest rate exchange agreements.
Fitch, Standard & Poor’s and Moody’s currently rate, with a sta-
ble outlook, the Company’s commercial paper F1, A-1 and P-2,
respectively; and its long-term debt A, A and A3, respectively. The
Company’s key metrics for monitoring its credit structure are shown
in the preceding table. While the Company targets these metrics for
ease of focus, it also considers similar credit ratios that incorporate
capitalized operating leases to estimate total adjusted debt. Total
McDonald’s Corporation Annual Report 2008 35