McDonalds 2008 Annual Report Download - page 30
Download and view the complete annual report
Please find page 30 of the 2008 McDonalds annual report below. You can navigate through the pages in the report by either clicking on the pages listed below, or by using the keyword search tool below to find specific information within the annual report.-
 1
1 -
2
-
3
-
4
-
5
-
6
-
7
-
8
-
9
-
10
-
11
-
12
-
13
-
14
-
15
-
16
-
17
-
18
-
19
-
 20
20 -
 21
21 -
 22
22 -
 23
23 -
 24
24 -
 25
25 -
 26
26 -
 27
27 -
 28
28 -
 29
29 -
 30
30 -
 31
31 -
 32
32 -
 33
33 -
 34
34 -
 35
35 -
 36
36 -
 37
37 -
 38
38 -
 39
39 -
 40
40 -
41
-
42
-
43
-
44
-
45
-
46
-
47
-
48
-
49
-
50
-
51
-
52
-
53
-
54
-
55
-
56
-
57
-
58
-
59
-
60
-
61
-
62
-
63
-
64
 |
 |

In the U.S., the increases in revenues in 2008 and 2007 were
primarily driven by our market-leading breakfast business and the
ongoing appeal of new products, as well as continued focus on
everyday value and convenience. New products introduced in
2008 included Southern Style Chicken products, Iced Coffee and
Sweet Tea, while new products introduced in 2007 included the
Southwest Salad and an extended Snack Wrap line. In 2008, rev-
enue growth was largely offset by the impact of the refranchising
strategy.
Europe’s constant currency increase in revenues in 2008 and
2007 was primarily due to strong comparable sales in Russia
(which is entirely Company-operated), France and the U.K., as well
as positive comparable sales in all other markets. These increases
were partly offset by the impact of the refranchising strategy, pri-
marily in the U.K. and Germany in 2008 and in the U.K. in 2007.
In APMEA, the constant currency increases in revenues in
2008 and 2007 were primarily driven by strong comparable sales
in Australia and China, as well as positive comparable sales
throughout the segment. In addition, expansion in China con-
tributed to the increases in both years.
In Other Countries & Corporate, Company-operated sales
declined in 2008 and 2007 while franchised revenues increased
primarily as a result of the Latam transaction in August 2007.
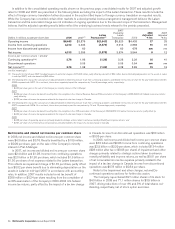
The following tables present Systemwide sales and
comparable sales increases:
Systemwide sales increases
Excluding currency
translation
2008 2007 2008 2007
U.S. 5% 5% 5% 5%
Europe 15 18 10 9
APMEA 19 17 12 13
Other Countries &
Corporate 16 19 14 12
Total 11% 12% 9% 8%
Comparable sales increases
2008 2007 2006
U.S. 4.0% 4.5% 5.2%
Europe 8.5 7.6 5.8
APMEA 9.0 10.6 5.5
Other Countries & Corporate 13.0 10.8 9.4
Total 6.9% 6.8% 5.7%
Restaurant Margins
The Company continues to optimize its restaurant ownership mix,
cash flow and returns through its refranchising strategy and
expects the shift to a greater percentage of franchised restaurants
to negatively impact consolidated revenues as Company-operated
sales shift to franchised sales, where we receive rent and/or royal-
ties. In addition, the Company expects a decrease in Company-
operated margin dollars and an increase in franchised margin
dollars, while margin percentages will vary based on sales and cost
structures of refranchised restaurants.
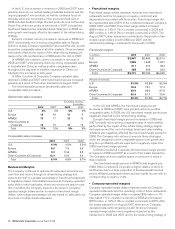
• Franchised margins
Franchised margin dollars represent revenues from franchised
restaurants less the Company’s occupancy costs (rent and
depreciation) associated with those sites. Franchised margin dol-
lars represented about 65% of the combined restaurant margins in
2008, 2007 and 2006. Franchised margin dollars increased
$695 million or 14% (11% in constant currencies) in 2008 and
$601 million or 14% (10% in constant currencies) in 2007. The
August 2007 Latam transaction contributed to the growth in fran-
chised margin dollars in both 2008 and 2007 and the
refranchising strategy contributed to the growth in 2008.
Franchised margins
In millions 2008 2007 2006
U.S. $2,867 $2,669 $2,513
Europe 1,965 1,648 1,357
APMEA 511 410 333
Other Countries & Corporate 388 309 232
Total $5,731 $5,036 $4,435
Percent of revenues
U.S. 83.3% 82.8% 82.3%
Europe 78.6 78.1 77.4
APMEA 89.6 88.3 87.8
Other Countries & Corporate 86.4 81.7 75.6
Total 82.3% 81.5% 80.7%
In the U.S. and APMEA, the franchised margin percent
increases in 2008 and 2007 were primarily driven by positive
comparable sales. In 2008, the U.S. franchised margin percent was
negatively impacted by the refranchising strategy.
Europe’s franchised margin percent increased in 2008 and
2007 primarily due to strong comparable sales in most markets,
partly offset by the impact of the refranchising strategy. Higher
rent expense and the cost of strategic brand and sales building
initiatives also negatively affected the franchised margin percent in
2008. The Company will continue to execute these strategies,
which are designed to drive comparable guest count growth and
long term profitability and are expected to negatively impact the
2009 franchised margin percent.
In Other Countries & Corporate, the franchised margin percent
increased in 2008 and 2007 as a result of the Latam transaction.
The Company receives royalties based on a percent of sales in
these markets.
The franchised margin percent in APMEA and, beginning in
2008, Other Countries & Corporate is higher relative to the U.S.
and Europe due to a large proportion of developmental licensed
and/or affiliated restaurants where we have royalty income with no
corresponding occupancy costs.
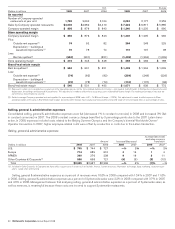
• Company-operated margins
Company-operated margin dollars represent sales by Company-
operated restaurants less the operating costs of these restaurants.
Company-operated margin dollars increased $39 million or 1%
(decreased 1% in constant currencies) in 2008 and increased
$372 million or 15% (10% in constant currencies) in 2007. After
the Latam transaction in August 2007, there are no Company-
operated restaurants remaining in Latin America. Company-
operated margin dollars were negatively impacted by this
transaction in 2008 and 2007 and by the refranchising strategy in
28 McDonald’s Corporation Annual Report 2008