McDonalds 2008 Annual Report Download - page 34
Download and view the complete annual report
Please find page 34 of the 2008 McDonalds annual report below. You can navigate through the pages in the report by either clicking on the pages listed below, or by using the keyword search tool below to find specific information within the annual report.-
 1
1 -
2
-
3
-
4
-
5
-
6
-
7
-
8
-
9
-
10
-
11
-
12
-
13
-
14
-
15
-
16
-
17
-
18
-
19
-
20
-
21
-
22
-
23
-
 24
24 -
 25
25 -
 26
26 -
 27
27 -
 28
28 -
 29
29 -
 30
30 -
 31
31 -
 32
32 -
 33
33 -
 34
34 -
 35
35 -
 36
36 -
 37
37 -
 38
38 -
 39
39 -
 40
40 -
 41
41 -
 42
42 -
 43
43 -
 44
44 -
45
-
46
-
47
-
48
-
49
-
50
-
51
-
52
-
53
-
54
-
55
-
56
-
57
-
58
-
59
-
60
-
61
-
62
-
63
-
64
 |
 |

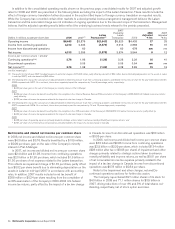
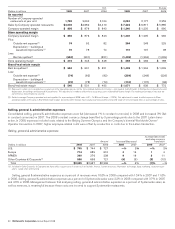
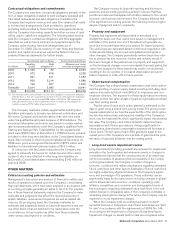
Operating income
Operating income
Amount Increase/(decrease)
Increase/(decrease)
excluding currency
translation
Dollars in millions 2008 2007 2006 2008 2007 2008 2007
U.S. $3,060 $ 2,842 $2,657 8% 7% 8% 7%
Europe 2,608 2,125 1,610 23 32 17 21
APMEA 819 616 364 33 69 28 59
Other Countries & Corporate (44) (1,704) (198) 97 nm 97 nm
Total $6,443 $ 3,879 $4,433 66% (12)% 62% (18)%
Latam transaction (1,641)
Total excluding Latam transaction* $6,443 $ 5,520 $4,433 17% 25% 14% 19%
nm Not meaningful.
* Results for 2007 included the impact of the Latam transaction in Other Countries & Corporate. This impact reflects an impairment charge of $1,665 million, partly offset by a benefit of
$24 million due to eliminating depreciation on the assets in Latam in mid-April 2007. In order to provide management’s view of the underlying business performance, results are also
shown excluding the impact of the Latam transaction.
In the U.S., 2008 and 2007 results increased primarily due to
higher franchised margin dollars. In 2007, operating income also
included higher Company-operated restaurant margin dollars
compared with 2006.
In Europe, results for 2008 and 2007 were driven by strong
performance in France, Russia and the U.K. as well as positive
results in Germany and most other markets. Impairment and other
charges, net in 2006 benefited the growth rate in 2007.
In APMEA, results for 2008 were driven by strong results in
Australia and China, and positive performance in most other mar-
kets. Results for 2007 were driven by improved results in China,
Japan, Australia, Hong Kong and most other markets.
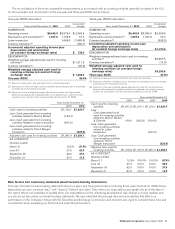
• Combined operating margin
Combined operating margin is defined as operating income as a
percent of total revenues. Combined operating margin for 2008,
2007 and 2006 was 27.4%, 17.0% and 21.2%, respectively.
Impairment and other charges negatively impacted the 2007 and
2006 combined operating margin by 7.4 percentage points and
0.7 percentage points, respectively.
Interest expense
Interest expense for 2008 increased primarily due to higher aver-
age debt levels, and to a lesser extent, higher average interest
rates. Interest expense for 2007 increased primarily due to higher
average interest rates and stronger foreign currencies, partly offset
by lower average debt levels.
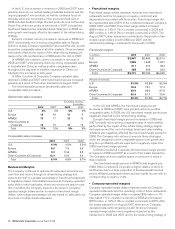
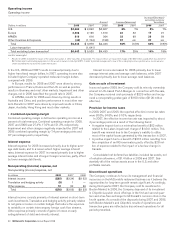
Nonoperating (income) expense, net
Nonoperating (income) expense, net
In millions 2008 2007 2006
Interest income $(85) $(124) $(152)
Translation and hedging activity (5) 1—
Other expense 12 20 29
Total $(78) $(103) $(123)
Interest income consists primarily of interest earned on short-term
cash investments. Translation and hedging activity primarily relates
to net gains or losses on certain hedges that reduce the exposure
to variability on certain intercompany foreign cash flow streams.
Other expense primarily consists of gains or losses on early
extinguishment of debt and minority interest.
Interest income decreased for 2008 primarily due to lower
average interest rates and average cash balances, while 2007
decreased primarily due to lower average cash balances.
Gain on sale of investment
In second quarter 2008, the Company sold its minority ownership
interest in U.K.-based Pret A Manger. In connection with the sale,
the Company received cash proceeds of $229 million and recog-
nized a nonoperating pretax gain of $160 million ($109 million
after tax).
Provision for income taxes
In 2008, 2007 and 2006, the reported effective income tax rates
were 30.0%, 34.6%, and 31.0%, respectively.
In 2007, the effective income tax rate was impacted by about
4 percentage points as a result of the following items:
• A negative impact due to a minimal tax benefit of $62 million
related to the Latam impairment charge of $1,641 million. This
benefit was minimal due to the Company’s inability to utilize
most of the capital losses generated by this transaction in 2007.
• A positive impact due to a benefit of $316 million resulting from
the completion of an IRS examination, partly offset by $28 mil-
lion of expense related to the impact of a tax law change in
Canada.
Consolidated net deferred tax liabilities included tax assets, net
of valuation allowance, of $1.4 billion in 2008 and 2007. Sub-
stantially all of the net tax assets arose in the U.S. and other
profitable markets.
Discontinued operations
The Company continues to focus its management and financial
resources on the McDonald’s restaurant business as it believes the
opportunities for long-term growth remain significant. Accordingly,
during third quarter 2007, the Company sold its investment in
Boston Market. In 2006, the Company disposed of its investment
in Chipotle via public stock offerings in the first and second quar-
ters and a tax-free exchange for McDonald’s common stock in the
fourth quarter. As a result of the disposals during 2007 and 2006,
both Boston Market’s and Chipotle’s results of operations and
transaction gains are reflected as discontinued operations for all
periods presented.
32 McDonald’s Corporation Annual Report 2008