McDonalds 2008 Annual Report Download - page 31
Download and view the complete annual report
Please find page 31 of the 2008 McDonalds annual report below. You can navigate through the pages in the report by either clicking on the pages listed below, or by using the keyword search tool below to find specific information within the annual report.-
 1
1 -
2
-
3
-
4
-
5
-
6
-
7
-
8
-
9
-
10
-
11
-
12
-
13
-
14
-
15
-
16
-
17
-
18
-
19
-
20
-
 21
21 -
 22
22 -
 23
23 -
 24
24 -
 25
25 -
 26
26 -
 27
27 -
 28
28 -
 29
29 -
 30
30 -
 31
31 -
 32
32 -
 33
33 -
 34
34 -
 35
35 -
 36
36 -
 37
37 -
 38
38 -
 39
39 -
 40
40 -
 41
41 -
42
-
43
-
44
-
45
-
46
-
47
-
48
-
49
-
50
-
51
-
52
-
53
-
54
-
55
-
56
-
57
-
58
-
59
-
60
-
61
-
62
-
63
-
64
 |
 |

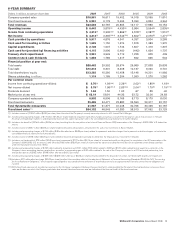
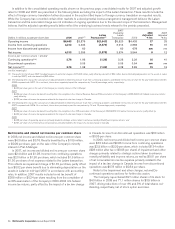
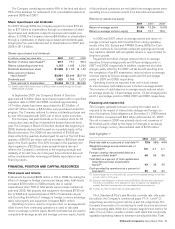
2008. The refranchising strategy had a positive impact on the
margin percent in 2008, primarily in the U.S. and Europe.
Company-operated margins
In millions 2008 2007 2006
U.S. $ 856 $ 876 $ 843
Europe 1,340 1,205 960
APMEA 584 471 341
Other Countries & Corporate 128 317 353
Total $2,908 $2,869 $2,497
Percent of sales
U.S. 18.5% 18.7% 19.1%
Europe 18.0 17.7 16.3
APMEA 15.9 15.0 12.8
Other Countries & Corporate 15.3 16.1 14.5
Total 17.6% 17.3% 16.2%
In the U.S., the Company-operated margin percent decreased
in 2008 and 2007 due to cost pressures including higher
commodity and labor costs, partly offset by positive comparable
sales.
Europe’s Company-operated margin percent increased in 2008
and 2007 primarily due to strong comparable sales, partly offset by
higher commodity and labor costs.
In APMEA, the Company-operated margin percent in 2008 and
2007 increased due to strong comparable sales in most markets.
Both years were negatively impacted by higher labor costs and
2008 was also negatively impacted by higher commodity costs.
In Other Countries & Corporate, the Company-operated margin
in 2007 benefited by about 100 basis points related to the dis-
continuation of depreciation on the assets in Latam from mid-April
through July 2007.
• Supplemental information regarding Company-
operated restaurants
We continually review our restaurant ownership mix with a goal of
improving local relevance, profits and returns. In most cases, fran-
chising is the best way to achieve these goals, but as previously
stated, Company-operated restaurants are also important to our
success.
We report results for Company-operated restaurants based on
their sales, less costs directly incurred by that business including
occupancy costs. We report the results for franchised restaurants
based on franchised revenues, less associated occupancy costs.
For this reason and because we manage our business based on
geographic segments and not on the basis of our ownership struc-
ture, we do not specifically allocate selling, general &
administrative expenses and other operating (income) expenses to
Company-operated or franchised restaurants. Other operating
items that relate to the Company-operated restaurants generally
include gains on sales of restaurant businesses and write-offs of
equipment and leasehold improvements.
We believe the following information about Company-operated
restaurants in our most significant markets provides an additional
perspective on this business. Management responsible for our
Company-operated restaurants in these markets analyzes the
Company-operated business on this basis to assess its perform-
ance. Management of the Company also considers this information
when evaluating restaurant ownership mix, subject to other rele-
vant considerations.
The following tables seek to illustrate the two components of
our Company-operated margins. The first of these relates
exclusively to restaurant operations, which we refer to below as
“Store operating margin.” The second relates to the value of our
Brand and the real estate interest we retain for which we charge
rent and royalties. We refer to this component as “Brand/real
estate margin.” Both Company-operated and conventional fran-
chised restaurants are charged rent and royalties, although rent
and royalties for Company-operated restaurants are eliminated in
consolidation. Rent and royalties for both restaurant ownership
types are based on a percentage of sales, and the actual rent
percentage varies depending on the level of McDonald’s invest-
ment in the restaurant. Royalty rates may also vary by market.
As shown in the following tables, in disaggregating the
components of our Company-operated margins, certain costs
with respect to Company-operated restaurants are reflected in
Brand/real estate margin. Those costs consist of rent payable by
McDonald’s to third parties on leased sites and depreciation for
buildings and leasehold improvements and constitute a portion of
occupancy & other operating expenses recorded on the
Consolidated statement of income. Store operating margins reflect
rent and royalty expenses, and those amounts are accounted for
as income in calculating Brand/real estate margin.
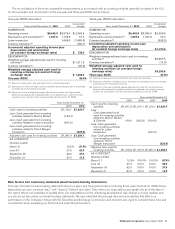
While we believe that the following information provides a
perspective in evaluating our Company-operated business, it is not
intended as a measure of our operating performance or as an
alternative to operating income or restaurant margins as reported
by the Company in accordance with accounting principles gen-
erally accepted in the U.S. In particular, as noted above, we do not
allocate selling, general & administrative expenses to our
Company-operated business. However, we believe that a range of
$40,000 to $50,000 per restaurant, on average, is a typical range
of costs to support this business in the U.S. The actual costs in
markets outside the U.S. will vary depending on local circum-
stances and the organizational structure of the market. These
costs reflect the indirect services we believe are necessary to pro-
vide the appropriate support of the restaurant.
McDonald’s Corporation Annual Report 2008 29