McDonalds 2008 Annual Report Download - page 52
Download and view the complete annual report
Please find page 52 of the 2008 McDonalds annual report below. You can navigate through the pages in the report by either clicking on the pages listed below, or by using the keyword search tool below to find specific information within the annual report.-
 1
1 -
2
-
3
-
4
-
5
-
6
-
7
-
8
-
9
-
10
-
11
-
12
-
13
-
14
-
15
-
16
-
17
-
18
-
19
-
20
-
21
-
22
-
23
-
24
-
25
-
26
-
27
-
28
-
29
-
30
-
31
-
32
-
33
-
34
-
35
-
36
-
37
-
38
-
39
-
40
-
41
-
 42
42 -
 43
43 -
 44
44 -
 45
45 -
 46
46 -
 47
47 -
 48
48 -
 49
49 -
 50
50 -
 51
51 -
 52
52 -
 53
53 -
 54
54 -
 55
55 -
 56
56 -
 57
57 -
 58
58 -
 59
59 -
 60
60 -
 61
61 -
 62
62 -
63
-
64
 |
 |

GAIN ON SALE OF INVESTMENT
In second quarter 2008, the Company sold its minority ownership
interest in U.K.-based Pret A Manger. In connection with the sale,
the Company received cash proceeds of $229.4 million and
recognized a nonoperating pretax gain of $160.1 million ($109.0
million after tax).
CONTINGENCIES
From time to time, the Company is subject to proceedings, lawsuits
and other claims related to competitors, customers, employees,
franchisees, government agencies, intellectual property, share-
holders and suppliers. The Company is required to assess the
likelihood of any adverse judgments or outcomes to these matters
as well as potential ranges of probable losses. A determination of
the amount of accrual required, if any, for these contingencies is
made after careful analysis of each matter. The required accrual
may change in the future due to new developments in each matter
or changes in approach such as a change in settlement strategy in
dealing with these matters. The Company does not believe that any
such matter currently being reviewed will have a material adverse
effect on its financial condition or results of operations.
In connection with the 2007 sale of the Company’s businesses
in Latam, the Company agreed to indemnify the buyers for certain
tax and other claims, certain of which are reflected as liabilities on
McDonald’s Consolidated balance sheet, totaling $141.8 million at
December 31, 2008 and $179.2 million at December 31, 2007.
The change in the balance was primarily due to foreign currency
translation. The Company mitigates the currency impact to income
through the use of forward foreign exchange agreements.
FRANCHISE ARRANGEMENTS
Conventional franchise arrangements generally include a lease
and a license and provide for payment of initial fees, as well as
continuing rent and royalties to the Company based upon a per-
cent of sales with minimum rent payments that parallel the
Company’s underlying leases and escalations (on properties that
are leased). Under this arrangement, franchisees are granted the
right to operate a restaurant using the McDonald’s System and, in
most cases, the use of a restaurant facility, generally for a period of
20 years. These franchisees pay related occupancy costs including
property taxes, insurance and maintenance. In addition, in certain
markets outside the U.S., franchisees pay a refundable, non-
interest bearing security deposit. Affiliates and developmental
licensees operating under license agreements pay a royalty to the
Company based upon a percent of sales, and may pay initial fees.
The results of operations of restaurant businesses purchased
and sold in transactions with franchisees were not material to the
consolidated financial statements for periods prior to purchase and
sale.
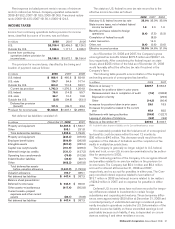
Revenues from franchised restaurants consisted of:
In millions 2008 2007 2006
Rents $4,612.8 $4,177.2 $3,756.1
Royalties 2,275.7 1,941.1 1,685.2
Initial fees 73.0 57.3 51.5
Revenues from franchised
restaurants $6,961.5 $6,175.6 $5,492.8
Future minimum rent payments due to the Company under
existing franchise arrangements are:
In millions Owned Sites Leased Sites Total
2009 $ 1,125.0 $ 965.1 $ 2,090.1
2010 1,091.2 936.6 2,027.8
2011 1,047.7 904.2 1,951.9
2012 1,014.1 872.2 1,886.3
2013 975.8 833.2 1,809.0
Thereafter 7,648.8 5,992.0 13,640.8
Total minimum payments $12,902.6 $10,503.3 $23,405.9
At December 31, 2008, net property and equipment under
franchise arrangements totaled $11.9 billion (including land of
$3.5 billion) after deducting accumulated depreciation and amor-
tization of $5.7 billion.
LEASING ARRANGEMENTS
At December 31, 2008, the Company was the lessee at 13,620
restaurant locations through ground leases (the Company leases
the land and the Company or franchisee owns the building) and
through improved leases (the Company leases land and buildings).
Lease terms for most restaurants are generally for 20 years and, in
many cases, provide for rent escalations and renewal options, with
certain leases providing purchase options. Escalation terms vary by
geographic segment with examples including fixed-rent escala-
tions, escalations based on an inflation index, and fair-value market
adjustments. The timing of these escalations generally ranges from
annually to every five years. For most locations, the Company is
obligated for the related occupancy costs including property taxes,
insurance and maintenance; however, for franchised sites, the
Company requires the franchisees to pay these costs. In addition,
the Company is the lessee under noncancelable leases covering
certain offices and vehicles.
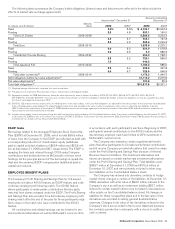
Future minimum payments required under existing operating
leases with initial terms of one year or more are:
In millions Restaurant Other Total
2009 $ 980.8 $ 65.3 $ 1,046.1
2010 918.7 52.9 971.6
2011 849.1 41.7 890.8
2012 779.6 29.8 809.4
2013 724.5 21.6 746.1
Thereafter 5,500.0 114.4 5,614.4
Total minimum payments $9,752.7 $325.7 $10,078.4
The following table provides detail of rent expense:
In millions 2008 2007 2006
Company-operated restaurants:
U.S. $ 73.7 $ 82.0 $ 81.6
Outside the U.S. 532.0 533.9 515.1
Total 605.7 615.9 596.7
Franchised restaurants:
U.S. 374.7 358.4 340.2
Outside the U.S. 409.4 364.5 312.5
Total 784.1 722.9 652.7
Other 101.8 98.5 104.5
Total rent expense $1,491.6 $1,437.3 $1,353.9
50 McDonald’s Corporation Annual Report 2008