McDonalds 2008 Annual Report Download - page 57
Download and view the complete annual report
Please find page 57 of the 2008 McDonalds annual report below. You can navigate through the pages in the report by either clicking on the pages listed below, or by using the keyword search tool below to find specific information within the annual report.-
 1
1 -
2
-
3
-
4
-
5
-
6
-
7
-
8
-
9
-
10
-
11
-
12
-
13
-
14
-
15
-
16
-
17
-
18
-
19
-
20
-
21
-
22
-
23
-
24
-
25
-
26
-
27
-
28
-
29
-
30
-
31
-
32
-
33
-
34
-
35
-
36
-
37
-
38
-
39
-
40
-
41
-
42
-
43
-
44
-
45
-
46
-
 47
47 -
 48
48 -
 49
49 -
 50
50 -
 51
51 -
 52
52 -
 53
53 -
 54
54 -
 55
55 -
 56
56 -
 57
57 -
 58
58 -
 59
59 -
 60
60 -
 61
61 -
 62
62 -
 63
63 -
 64
64
 |
 |

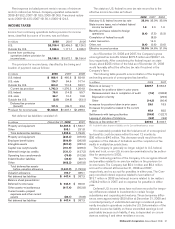
QUARTERLY RESULTS (UNAUDITED)
In millions, except per share data Quarters ended
December 31 Quarters ended
September 30 Quarters ended
June 30 Quarters ended
March 31
2008 2007 2008 2007 2008 2007 2008 2007
Revenues
Sales by Company-operated
restaurants $3,855.0 $4,103.2 $4,411.1 $4,276.2 $4,296.0 $4,317.8 $3,998.8 $3,913.8
Revenues from franchised
restaurants 1,710.0 1,650.4 1,856.2 1,624.7 1,779.3 1,521.6 1,616.0 1,378.9
Total revenues 5,565.0 5,753.6 6,267.3 5,900.9 6,075.3 5,839.4 5,614.8 5,292.7
Company-operated margin 664.1 705.3 823.9 783.9 760.8 759.6 659.2 620.5
Franchised margin 1,411.7 1,355.3 1,539.3 1,337.3 1,464.0 1,240.1 1,316.2 1,103.2
Operating income (loss) 1,502.2 1,354.6 1,823.7 1,524.8 1,654.2 (181.7)(4) 1,462.8 1,181.3
Income (loss) from continuing
operations 985.3 1,273.2(1) 1,191.3 1,003.7 1,190.5(3) (708.4)(4) 946.1 766.5
Net income (loss) $ 985.3 $1,273.2(1) $1,191.3 $1,071.2(2) $1,190.5(3) $ (711.7)(4) $ 946.1 $ 762.4
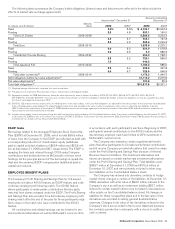
Per common share—basic:
Income (loss) from
continuing operations $ 0.88 $ 1.08(1) $ 1.07 $ 0.85 $ 1.05(3) $ (0.59)(4) $ 0.83 $ 0.64
Net income (loss) $ 0.88 $ 1.08(1) $ 1.07 $ 0.90(2) $ 1.05(3) $ (0.60)(4) $ 0.83 $ 0.63
Per common share—diluted:
Income (loss) from
continuing operations $ 0.87 $ 1.06(1) $ 1.05 $ 0.83 $ 1.04(3) $ (0.59)(4) $ 0.81 $ 0.63
Net income (loss) $ 0.87 $ 1.06(1) $ 1.05 $ 0.89(2) $ 1.04(3) $ (0.60)(4) $ 0.81 $ 0.62
Dividends declared per
common share $ 0.875(5) $ 1.50 $ 0.375 $ 0.375
Weighted-average common
shares—basic 1,115.4 1,173.7 1,116.6 1,185.0 1,128.9 1,193.7 1,145.6 1,201.2
Weighted-average common
shares—diluted 1,131.6 1,196.8 1,136.0 1,207.1 1,148.8 1,193.7 1,165.3 1,222.3
Market price per common
share:
High $ 64.02 $ 63.69 $ 67.00 $ 55.73 $ 61.76 $ 52.88 $ 59.48 $ 46.21
Low 45.79 54.67 55.55 46.64 55.14 44.26 49.36 42.31
Close 62.19 58.91 61.70 54.47 56.22 50.76 55.77 45.05
(1) Includes an income tax benefit of $316.4 million ($0.26 per share) resulting from the completion of an IRS examination of the Company’s 2003-2004 U.S. federal tax returns.
(2) Includes income from discontinued operations of $67.5 million after tax ($0.05 per share–basic, $0.06 per share–diluted) primarily due to the gain on the sale of Boston Market.
(3) Includes income of $109.0 million after tax ($0.09 per share-basic, $0.10 per share-diluted) from the sale of the Company’s minority ownership interest in U.K.-based Pret A Manger.
(4) Includes net pretax and after tax expense of $1.6 billion ($1.32 per share from continuing operations–basic, $1.33 per share net income–basic, $1.31 per share–diluted) related to the
sale of Latam to a developmental licensee.
(5) Includes a $0.375 per share dividend declared and paid in third quarter and a $0.50 per share dividend declared in third quarter and paid in fourth quarter.
McDonald’s Corporation Annual Report 2008 55