McDonalds 2008 Annual Report Download - page 56
Download and view the complete annual report
Please find page 56 of the 2008 McDonalds annual report below. You can navigate through the pages in the report by either clicking on the pages listed below, or by using the keyword search tool below to find specific information within the annual report.-
 1
1 -
2
-
3
-
4
-
5
-
6
-
7
-
8
-
9
-
10
-
11
-
12
-
13
-
14
-
15
-
16
-
17
-
18
-
19
-
20
-
21
-
22
-
23
-
24
-
25
-
26
-
27
-
28
-
29
-
30
-
31
-
32
-
33
-
34
-
35
-
36
-
37
-
38
-
39
-
40
-
41
-
42
-
43
-
44
-
45
-
 46
46 -
 47
47 -
 48
48 -
 49
49 -
 50
50 -
 51
51 -
 52
52 -
 53
53 -
 54
54 -
 55
55 -
 56
56 -
 57
57 -
 58
58 -
 59
59 -
 60
60 -
 61
61 -
 62
62 -
 63
63 -
 64
64
 |
 |

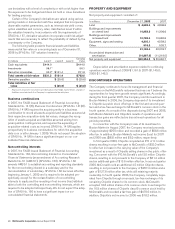
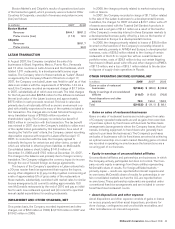
Total U.S. costs for the Profit Sharing and Savings Plan, includ-
ing nonqualified benefits and related hedging activities, were (in
millions): 2008–$61.2; 2007–$57.6; 2006–$60.1. Certain sub-
sidiaries outside the U.S. also offer profit sharing, stock purchase
or other similar benefit plans. Total plan costs outside the U.S.
were (in millions): 2008–$55.4; 2007–$62.7; 2006–$69.8.
The total combined liabilities for international retirement plans
were $131.1 million and $129.4 million at December 31, 2008
and 2007, respectively, primarily in the U.K. and Canada.
Other postretirement benefits and post-employment benefits
were immaterial.
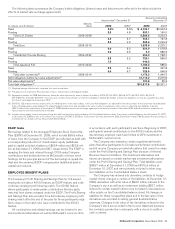
SHARE-BASED COMPENSATION
The Company maintains a share-based compensation plan which authorizes the granting of various equity-based incentives including stock
options and restricted stock units (RSUs) to employees and nonemployee directors. The number of shares of common stock reserved for
issuance under the plans was 97.3 million at December 31, 2008, including 40.9 million available for future grants.
Stock options
Stock options to purchase common stock are granted with an exercise price equal to the closing market price of the Company’s stock on
the date of grant. Substantially all of the options become exercisable in four equal installments, beginning a year from the date of the
grant, and generally expire 10 years from the grant date. Options granted between May 1, 1999 and December 31, 2000 (approximately
11 million options outstanding at December 31, 2008) expire 13 years from the date of grant.
Intrinsic value for stock options is defined as the difference between the current market value and the exercise price. During 2008,
2007 and 2006, the total intrinsic value of stock options exercised was $549.5 million, $815.3 million and $412.6 million, respectively.
Cash received from stock options exercised during 2008 was $548.2 million and the actual tax benefit realized for tax deductions from
stock options exercised totaled $160.2 million. The Company uses treasury shares purchased under the Company’s share repurchase
program to satisfy share-based exercises.
A summary of the status of the Company’s stock option grants as of December 31, 2008, 2007 and 2006, and changes during the
years then ended, is presented in the following table:
2008 2007 2006
Options Shares in
millions
Weighted-
average
exercise
price
Weighted-
average
remaining
contractual
life in years
Aggregate
intrinsic
value in
millions Shares in
millions
Weighted-
average
exercise
price Shares in
millions
Weighted-
average
exercise
price
Outstanding at beginning of year 67.5 $31.85 101.9 $30.03 136.3 $28.90
Granted 5.3 56.55 5.7 45.02 7.0 36.36
Exercised (18.7) 29.97 (38.4) 28.89 (37.7) 26.86
Forfeited/expired (0.7) 37.53 (1.7) 33.63 (3.7) 32.51
Outstanding at end of year 53.4 $34.88 5.22 $1,458.0 67.5 $31.85 101.9 $30.03
Exercisable at end of year 40.8 $31.21 4.31 $1,263.6 52.6 78.7
RSUs
RSUs generally vest 100% on the third anniversary of the grant
and are payable in either shares of McDonald’s common stock or
cash, at the Company’s discretion. Certain executives have been
awarded RSUs that vest based on Company performance. The fair
value of each RSU granted is equal to the market price of the
Company’s stock at date of grant less the present value of
expected dividends over the vesting period.
A summary of the Company’s RSU activity during the years
ended December 31, 2008, 2007 and 2006 is presented in the
following table:
2008 2007 2006
RSUs Shares in
millions
Weighted-
average
grant
date fair
value Shares in
millions
Weighted-
average
grant
date fair
value Shares in
millions
Weighted-
average
grant
date fair
value
Nonvested at beginning of year 3.4 $35.94 2.6 $33.00 2.6 $23.60
Granted 0.8 51.10 1.2 41.73 1.4 34.12
Vested (1.1) 30.38 (0.2) 32.78 (1.3) 15.24
Forfeited (0.1) 40.41 (0.2) 35.97 (0.1) 31.78
Nonvested at end of year 3.0 $40.88 3.4 $35.94 2.6 $33.00
The Company realized tax deductions of $8.8 million from RSUs vested during 2008. The total fair value of RSUs vested during
2008, 2007 and 2006 was $56.4 million, $12.6 million and $43.8 million, respectively.
54 McDonald’s Corporation Annual Report 2008