Microsoft 2013 Annual Report Download - page 22
Download and view the complete annual report
Please find page 22 of the 2013 Microsoft annual report below. You can navigate through the pages in the report by either clicking on the pages listed below, or by using the keyword search tool below to find specific information within the annual report.-
 1
1 -
2
-
3
-
4
-
5
-
6
-
7
-
8
-
9
-
10
-
11
-
 12
12 -
 13
13 -
 14
14 -
 15
15 -
 16
16 -
 17
17 -
 18
18 -
 19
19 -
 20
20 -
 21
21 -
 22
22 -
 23
23 -
 24
24 -
 25
25 -
 26
26 -
 27
27 -
 28
28 -
 29
29 -
 30
30 -
 31
31 -
 32
32 -
33
-
34
-
35
-
36
-
37
-
38
-
39
-
40
-
41
-
42
-
43
-
44
-
45
-
46
-
47
-
48
-
49
-
50
-
51
-
52
-
53
-
54
-
55
-
56
-
57
-
58
-
59
-
60
-
61
-
62
-
63
-
64
-
65
-
66
-
67
-
68
-
69
-
70
-
71
-
72
-
73
-
74
-
75
-
76
-
77
-
78
-
79
-
80
-
81
-
82
-
83
-
84
-
85
-
86
-
87
 |
 |

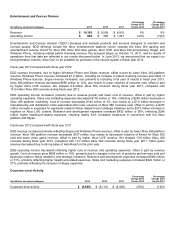
product costs associated with Surface and Windows 8, including a charge for Surface RT inventory adjustments of
approximately $900 million. Sales and marketing expenses increased $1.0 billion or 34%, reflecting an $898 million
increase in advertising costs associated primarily with Windows 8 and Surface.
Fiscal year 2012 compared with fiscal year 2011
Windows Division revenue reflected relative performance in the PC market segments. We estimate that sales of PCs to
businesses grew approximately 4% and sales of PCs to consumers decreased 1%. Excluding a decline in sales of
netbooks, we estimate that sales of PCs to consumers grew approximately 5%. Taken together, the total PC market
increased an estimated 0% to 2%. Relative to PC market growth, Windows Division revenue was negatively impacted by
higher growth in emerging markets, where average selling prices are lower than developed markets, and the deferral of
$540 million of revenue relating to the Windows Upgrade Offer.
Windows Division operating income decreased, due mainly to lower revenue and a $172 million or 11% increase in
research and development expenses, primarily associated with the Windows 8 operating system.
Server and Tools
(In millions, except percentages)
2013
2012
2011
Percentage
Change 2013
Versus 2012
Percentage
Change
2012
Versus
2011
Revenue
$ 20,281
$ 18,534
$ 16,559
9%
12%
Operating income
$ 8,164
$ 7,235
$ 6,105
13%
19%
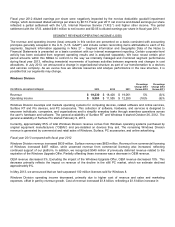
Server and Tools develops and markets technology and related services that enable information technology professionals
and their systems to be more productive and efficient. Server and Tools product and service offerings include Windows
Server, Microsoft SQL Server, Windows Azure, Visual Studio, System Center products, Windows Embedded device
platforms, and Enterprise Services. Enterprise Services comprise Premier product support services and Microsoft
Consulting Services. We also offer developer tools, training, and certification. Approximately 80% of Server and Tools
revenue comes from product revenue, including purchases through volume licensing programs, licenses sold to OEMs,
and retail packaged product, while the remainder comes from Enterprise Services.
Fiscal year 2013 compared with fiscal year 2012
Server and Tools revenue increased in both product sales and Enterprise Services. Product revenue increased $1.3
billion or 9%, driven primarily by growth in Microsoft SQL Server, System Center, and Windows Server. Enterprise
Services revenue grew $434 million or 11%, due to growth in both Premier product support and consulting services.
Server and Tools operating income increased, primarily due to revenue growth, offset in part by higher cost of revenue
and sales and marketing expenses. Cost of revenue grew $589 million or 15%, reflecting a $269 million increase in
headcount-related expenses and a $169 million increase in datacenter expenses. Headcount-related expenses increased
due mainly to higher Enterprise Services headcount supporting revenue growth, while datacenter expenses grew primarily
to support our online services offerings. Sales and marketing expenses grew $160 million or 3%, reflecting increased fees
paid to third-party enterprise software advisors and corporate sales and marketing activities.
Fiscal year 2012 compared with fiscal year 2011
Server and Tools revenue increased in both product sales and Enterprise Services. Product revenue increased $1.4
billion or 11%, driven primarily by growth in SQL Server, Windows Server, and System Center, reflecting continued
adoption of the Windows platform. Enterprise Services revenue grew $585 million or 17%, due to growth in both Premier
product support and consulting services.