Microsoft 2013 Annual Report Download - page 64
Download and view the complete annual report
Please find page 64 of the 2013 Microsoft annual report below. You can navigate through the pages in the report by either clicking on the pages listed below, or by using the keyword search tool below to find specific information within the annual report.-
 1
1 -
2
-
3
-
4
-
5
-
6
-
7
-
8
-
9
-
10
-
11
-
12
-
13
-
14
-
15
-
16
-
17
-
18
-
19
-
20
-
21
-
22
-
23
-
24
-
25
-
26
-
27
-
28
-
29
-
30
-
31
-
32
-
33
-
34
-
35
-
36
-
37
-
38
-
39
-
40
-
41
-
42
-
43
-
44
-
45
-
46
-
47
-
48
-
49
-
50
-
51
-
52
-
53
-
 54
54 -
 55
55 -
 56
56 -
 57
57 -
 58
58 -
 59
59 -
 60
60 -
 61
61 -
 62
62 -
 63
63 -
 64
64 -
 65
65 -
 66
66 -
 67
67 -
 68
68 -
 69
69 -
 70
70 -
 71
71 -
 72
72 -
 73
73 -
 74
74 -
75
-
76
-
77
-
78
-
79
-
80
-
81
-
82
-
83
-
84
-
85
-
86
-
87
 |
 |
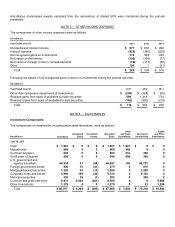
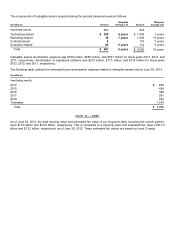
The components of intangible assets acquired during the periods presented were as follows:
(In millions)
Amount
Weighted
Average Life
Amount
Weighted
Average Life
Year Ended June 30,
2013
2012
Technology-based
$ 539
4 years
$ 1,548
7 years
Marketing-related
39
7 years
1,249
15 years
Contract-based
0
115
7 years
Customer-related
89
6 years
114
5 years
Total
$ 667
5 years
$ 3,026
10 years
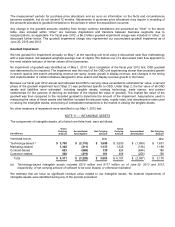
Intangible assets amortization expense was $739 million, $558 million, and $537 million for fiscal years 2013, 2012, and
2011, respectively. Amortization of capitalized software was $210 million, $117 million, and $114 million for fiscal years
2013, 2012, and 2011, respectively.
The following table outlines the estimated future amortization expense related to intangible assets held at June 30, 2013:
(In millions)
Year Ending June 30,
2014
$ 645
2015
454
2016
382
2017
281
2018
242
Thereafter
1,079
Total
$ 3,083
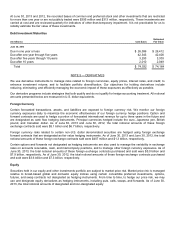
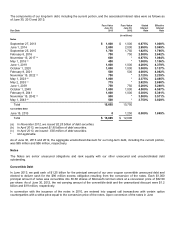
NOTE 12 — DEBT
As of June 30, 2013, the total carrying value and estimated fair value of our long-term debt, including the current portion,
were $15.6 billion and $15.8 billion, respectively. This is compared to a carrying value and estimated fair value of $11.9
billion and $13.2 billion, respectively, as of June 30, 2012. These estimated fair values are based on Level 2 inputs.