Microsoft 2013 Annual Report Download - page 61
Download and view the complete annual report
Please find page 61 of the 2013 Microsoft annual report below. You can navigate through the pages in the report by either clicking on the pages listed below, or by using the keyword search tool below to find specific information within the annual report.-
 1
1 -
2
-
3
-
4
-
5
-
6
-
7
-
8
-
9
-
10
-
11
-
12
-
13
-
14
-
15
-
16
-
17
-
18
-
19
-
20
-
21
-
22
-
23
-
24
-
25
-
26
-
27
-
28
-
29
-
30
-
31
-
32
-
33
-
34
-
35
-
36
-
37
-
38
-
39
-
40
-
41
-
42
-
43
-
44
-
45
-
46
-
47
-
48
-
49
-
50
-
 51
51 -
 52
52 -
 53
53 -
 54
54 -
 55
55 -
 56
56 -
 57
57 -
 58
58 -
 59
59 -
 60
60 -
 61
61 -
 62
62 -
 63
63 -
 64
64 -
 65
65 -
 66
66 -
 67
67 -
 68
68 -
 69
69 -
 70
70 -
 71
71 -
72
-
73
-
74
-
75
-
76
-
77
-
78
-
79
-
80
-
81
-
82
-
83
-
84
-
85
-
86
-
87
 |
 |
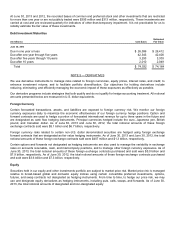
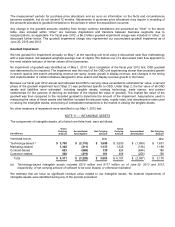
The following table reconciles the total Net Fair Value of assets above to the balance sheet presentation of these same
assets in Note 4 – Investments.
(In millions)
June 30,
2013
2012
Net fair value of assets measured at fair value on a recurring basis
$ 84,468
$ 69,623
Cash
1,967
2,019
Common and preferred stock measured at fair value on a nonrecurring basis
395
313
Other investments measured at fair value on a nonrecurring basis
1,256
1,043
Less derivative net assets classified as other current assets
(213)
(185)
Other
(7)
3
Recorded basis of investment components
$ 87,866
$ 72,816
Financial Assets and Liabilities Measured at Fair Value on a Nonrecurring Basis
During fiscal year 2013 and 2012, we did not record any material other-than-temporary impairments on financial assets
required to be measured at fair value on a nonrecurring basis.
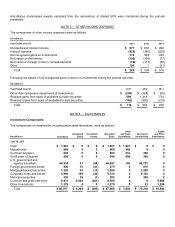
NOTE 7 — INVENTORIES
The components of inventories were as follows:
(In millions)
June 30,
2013
2012
Raw materials
$ 328
$ 210
Work in process
201
96
Finished goods
1,409
831
Total
$ 1,938
$ 1,137
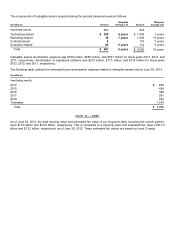
NOTE 8 — PROPERTY AND EQUIPMENT
The components of property and equipment were as follows:
(In millions)
June 30,
2013
2012
Land
$ 525
$ 528
Buildings and improvements
7,326
6,768
Leasehold improvements
2,946
2,550
Computer equipment and software
9,242
7,298
Furniture and equipment
2,465
2,087
Total, at cost
22,504
19,231
Accumulated depreciation
(12,513)
(10,962)
Total, net
$ 9,991
$ 8,269
During fiscal years 2013, 2012, and 2011, depreciation expense was $2.6 billion, $2.2 billion, and $2.0 billion,
respectively.