Microsoft 2013 Annual Report Download - page 25
Download and view the complete annual report
Please find page 25 of the 2013 Microsoft annual report below. You can navigate through the pages in the report by either clicking on the pages listed below, or by using the keyword search tool below to find specific information within the annual report.-
 1
1 -
2
-
3
-
4
-
5
-
6
-
7
-
8
-
9
-
10
-
11
-
12
-
13
-
14
-
 15
15 -
 16
16 -
 17
17 -
 18
18 -
 19
19 -
 20
20 -
 21
21 -
 22
22 -
 23
23 -
 24
24 -
 25
25 -
 26
26 -
 27
27 -
 28
28 -
 29
29 -
 30
30 -
 31
31 -
 32
32 -
 33
33 -
 34
34 -
 35
35 -
36
-
37
-
38
-
39
-
40
-
41
-
42
-
43
-
44
-
45
-
46
-
47
-
48
-
49
-
50
-
51
-
52
-
53
-
54
-
55
-
56
-
57
-
58
-
59
-
60
-
61
-
62
-
63
-
64
-
65
-
66
-
67
-
68
-
69
-
70
-
71
-
72
-
73
-
74
-
75
-
76
-
77
-
78
-
79
-
80
-
81
-
82
-
83
-
84
-
85
-
86
-
87
 |
 |

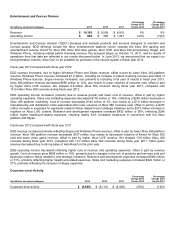
Entertainment and Devices Division
(In millions, except percentages)
2013
2012
2011
Percentage
Change 2013
Versus 2012
Percentage
Change
2012
Versus 2011
Revenue
$ 10,165
$ 9,599
$ 8,915
6%
8%
Operating income
$ 848
$ 380
$ 1,261
123%
(70)%
Entertainment and Devices Division (“EDD”) develops and markets products and services designed to entertain and
connect people. EDD offerings include the Xbox entertainment platform (which includes the Xbox 360 gaming and
entertainment console, Kinect for Xbox 360, Xbox 360 video games, Xbox LIVE, and Xbox 360 accessories), Skype, and
Windows Phone, including related patent licensing revenue. We acquired Skype on October 13, 2011, and its results of
operations from that date are reflected in our results discussed below. In June 2013, we announced that we expect our
next generation console, Xbox One, to be available for purchase in the second quarter of fiscal year 2014.
Fiscal year 2013 compared with fiscal year 2012
EDD revenue increased, due to higher Windows Phone and Skype revenue, offset in part by lower Xbox 360 platform
revenue. Windows Phone revenue increased $1.2 billion, including an increase in patent licensing revenue and sales of
Windows Phone licenses. Skype revenue increased, due primarily to including a full year of results in fiscal year 2013.
Xbox 360 platform revenue decreased $950 million or 12%, due mainly to lower volumes of consoles sold, offset in part
by higher Xbox LIVE revenue. We shipped 9.8 million Xbox 360 consoles during fiscal year 2013, compared with
13.0 million Xbox 360 consoles during fiscal year 2012.
EDD operating income increased, primarily due to revenue growth and lower cost of revenue, offset in part by higher
operating expenses. Sales and marketing expenses decreased $176 million or 16%, reflecting a $248 million decrease in
Xbox 360 platform marketing. Cost of revenue decreased $143 million or 2%, due mainly to a $1.0 billion decrease in
manufacturing and distribution costs associated with lower volumes of Xbox 360 consoles sold, offset in part by a $375
million increase in expenses for payments made to Nokia related to joint strategic initiatives and a $273 million increase in
royalties on Xbox LIVE content. Research and development expenses increased $432 million or 28%, reflecting $246
million higher headcount-related expenses, resulting mainly from increased headcount in connection with the Xbox
platform and Skype.
Fiscal year 2012 compared with fiscal year 2011
EDD revenue increased primarily reflecting Skype and Windows Phone revenue, offset in part by lower Xbox 360 platform
revenue. Xbox 360 platform revenue decreased $107 million, due mainly to decreased volumes of Kinect for Xbox 360
sold and lower video game revenue, offset in part by higher Xbox LIVE revenue. We shipped 13.0 million Xbox 360
consoles during fiscal year 2012, compared with 13.7 million Xbox 360 consoles during fiscal year 2011. Video game
revenue decreased due to strong sales of Halo Reach in the prior year.
EDD operating income decreased reflecting higher cost of revenue and operating expenses, offset in part by revenue
growth. Cost of revenue grew $896 million or 16%, primarily due to changes in the mix of products and services sold and
payments made to Nokia related to joint strategic initiatives. Research and development expenses increased $366 million
or 31%, primarily reflecting higher headcount-related expenses. Sales and marketing expenses increased $242 million or
27%, primarily reflecting the inclusion of Skype expenses.
Corporate-Level Activity
(In millions, except percentages)
2013
2012
2011
Percentage
Change 2013
Versus 2012
Percentage
Change
2012
Versus 2011
Corporate-level activity
$ (6,665)
$ (5,114)
$ (4,506)
(30)%
(13)%