Microsoft 2013 Annual Report Download - page 78
Download and view the complete annual report
Please find page 78 of the 2013 Microsoft annual report below. You can navigate through the pages in the report by either clicking on the pages listed below, or by using the keyword search tool below to find specific information within the annual report.-
 1
1 -
2
-
3
-
4
-
5
-
6
-
7
-
8
-
9
-
10
-
11
-
12
-
13
-
14
-
15
-
16
-
17
-
18
-
19
-
20
-
21
-
22
-
23
-
24
-
25
-
26
-
27
-
28
-
29
-
30
-
31
-
32
-
33
-
34
-
35
-
36
-
37
-
38
-
39
-
40
-
41
-
42
-
43
-
44
-
45
-
46
-
47
-
48
-
49
-
50
-
51
-
52
-
53
-
54
-
55
-
56
-
57
-
58
-
59
-
60
-
61
-
62
-
63
-
64
-
65
-
66
-
67
-
 68
68 -
 69
69 -
 70
70 -
 71
71 -
 72
72 -
 73
73 -
 74
74 -
 75
75 -
 76
76 -
 77
77 -
 78
78 -
 79
79 -
 80
80 -
 81
81 -
 82
82 -
 83
83 -
 84
84 -
 85
85 -
 86
86 -
 87
87
 |
 |

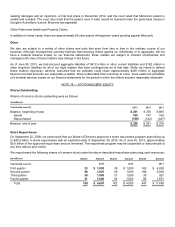
As of June 30, 2013, approximately four million options that were granted in conjunction with business acquisitions were
outstanding. These options have an exercise price range of $0.01 to $29.24 and a weighted average exercise price of
$7.33.
During the periods reported, the following stock option exercise activity occurred:
(In millions)
2013
2012
2011
Total intrinsic value of stock options exercised
$ 197
$ 456
$ 222
Cash received from stock option exercises
$ 382
$ 1,410
$ 1,954
Tax benefit realized from stock option exercises
$ 69
$ 160
$ 77
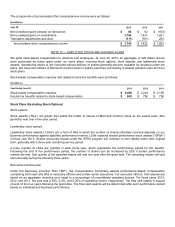
Employee Stock Purchase Plan
We have an employee stock purchase plan (the “Plan”) for all eligible employees. Shares of our common stock may be
purchased by employees at three-month intervals at 90% of the fair market value on the last trading day of each three-
month period. Employees may purchase shares having a value not exceeding 15% of their gross compensation during an
offering period. Employees purchased the following shares during the periods presented:
(Shares in millions)
Year Ended June 30,
2013
2012
2011
Shares purchased
20
20
20
Average price per share
$ 26.81
$ 25.03
$ 22.98
At June 30, 2013, 191 million shares of our common stock were reserved for future issuance through the Plan.
Savings Plan
We have a savings plan in the U.S. that qualifies under Section 401(k) of the Internal Revenue Code, and a number of
savings plans in international locations. Participating U.S. employees may contribute up to 75% of their salary, but not
more than statutory limits. We contribute fifty cents for each dollar a participant contributes in this plan, with a maximum
contribution of 3% of a participant’s earnings. Matching contributions for all plans were $393 million, $373 million, and
$282 million in fiscal years 2013, 2012, and 2011, respectively, and were expensed as contributed. Matching contributions
are invested proportionate to each participant’s voluntary contributions in the investment options provided under the plan.
Investment options in the U.S. plan include Microsoft common stock, but neither participant nor our matching contributions
are required to be invested in Microsoft common stock.
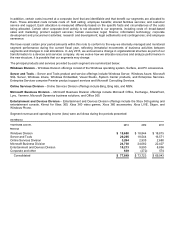
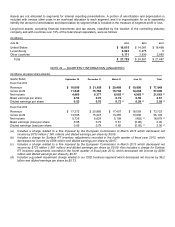
NOTE 21 — SEGMENT INFORMATION AND GEOGRAPHIC DATA
In its operation of the business, management, including our chief operating decision maker, the company’s Chief
Executive Officer, reviews certain financial information, including segmented internal profit and loss statements prepared
on a basis not consistent with U.S. GAAP. The segment information within this note is reported on that basis. During the
periods presented, our five segments were Windows Division, Server and Tools, Online Services Division, Microsoft
Business Division, and Entertainment and Devices Division. During the three months ended December 31, 2012, we
changed the name of our Windows & Windows Live Division to Windows Division.
Due to the integrated structure of our business, certain revenue earned and costs incurred by one segment may benefit
other segments. Revenue on certain contracts may be allocated among the segments based on the relative value of the
underlying products and services. Costs that are identifiable are allocated to the segments that benefit to incent cross-
collaboration among our segments so that one segment is not solely burdened by the cost of a mutually beneficial activity.
Allocated costs may include those relating to development and marketing of products and services from which multiple
segments benefit, or those costs relating to services performed by one segment on behalf of other segments. Each
allocation is measured differently based on the specific facts and circumstances of the costs being allocated.