Microsoft 2013 Annual Report Download - page 29
Download and view the complete annual report
Please find page 29 of the 2013 Microsoft annual report below. You can navigate through the pages in the report by either clicking on the pages listed below, or by using the keyword search tool below to find specific information within the annual report.-
 1
1 -
2
-
3
-
4
-
5
-
6
-
7
-
8
-
9
-
10
-
11
-
12
-
13
-
14
-
15
-
16
-
17
-
18
-
 19
19 -
 20
20 -
 21
21 -
 22
22 -
 23
23 -
 24
24 -
 25
25 -
 26
26 -
 27
27 -
 28
28 -
 29
29 -
 30
30 -
 31
31 -
 32
32 -
 33
33 -
 34
34 -
 35
35 -
 36
36 -
 37
37 -
 38
38 -
 39
39 -
40
-
41
-
42
-
43
-
44
-
45
-
46
-
47
-
48
-
49
-
50
-
51
-
52
-
53
-
54
-
55
-
56
-
57
-
58
-
59
-
60
-
61
-
62
-
63
-
64
-
65
-
66
-
67
-
68
-
69
-
70
-
71
-
72
-
73
-
74
-
75
-
76
-
77
-
78
-
79
-
80
-
81
-
82
-
83
-
84
-
85
-
86
-
87
 |
 |
impairments were $208 million in fiscal year 2013, compared with $298 million in fiscal year 2012. Net losses on
derivatives decreased due to gains on equity derivatives in the current fiscal year as compared with losses in the prior
fiscal year, and lower losses on commodity and foreign exchange derivatives as compared to the prior fiscal year, offset in
part by losses on interest-rate derivatives in the current fiscal year as compared to gains in the prior fiscal year. For the
current year, other reflects recognized gains on divestitures, including the gain recognized upon the divestiture of our 50%
share in the MSNBC joint venture.
Fiscal year 2012 compared with fiscal year 2011
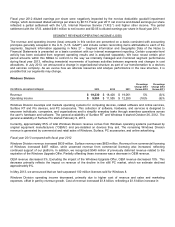
Dividends and interest income decreased due to lower yields on our fixed-income investments, offset in part by higher
average portfolio investment balances. Interest expense increased due to our increased issuance of debt in the prior year.
Net recognized gains on investments increased, primarily due to higher gains on sales of equity and fixed-income
securities and a gain recognized on the partial sale of our Facebook holding upon the initial public offering on May 18,
2012, offset in part by higher other-than-temporary impairments. Other-than-temporary impairments were $298 million in
fiscal year 2012, compared with $80 million in fiscal year 2011. Net losses on derivatives increased due to losses on
commodity and equity derivatives in the current fiscal year as compared with gains in the prior fiscal year, offset in part by
fewer losses on foreign exchange contracts in the current fiscal year as compared to the prior fiscal year. Changes in
foreign currency remeasurements were primarily due to currency movements net of our hedging activities.
Income Taxes
Fiscal year 2013 compared with fiscal year 2012
Our effective tax rate for fiscal years 2013 and 2012 was approximately 19% and 24%, respectively. Our effective tax rate
was lower than the U.S. federal statutory rate primarily due to earnings taxed at lower rates in foreign jurisdictions
resulting from producing and distributing our products and services through our foreign regional operations centers in
Ireland, Singapore, and Puerto Rico.
Our fiscal year 2013 effective rate decreased by 5% from fiscal year 2012 mainly due to a nonrecurring $6.2 billion non-
tax deductible goodwill impairment charge that was recorded in fiscal year 2012. The goodwill impairment charge
increased our effective tax rate by 10% in fiscal year 2012. In addition, in fiscal years 2013 and 2012, we recognized a
reduction of 18% and 21%, respectively, to the effective tax rate due to foreign earnings taxed at lower rates. The
decrease in our effective tax rate for fiscal year 2013 was primarily offset by a 1% increase related to the EU fine, which is
not tax deductible.
Changes in the mix of income before income taxes between the U.S. and foreign countries also impacted our effective tax
rates and resulted primarily from changes in the geographic distribution of and changes in consumer demand for our
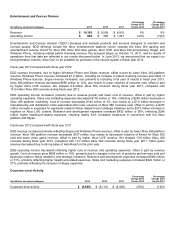
products and services. As discussed above, Windows Division operating income declined $2.1 billion in fiscal year 2013,
while MBD and Server and Tools operating income increased $362 million and $929 million, respectively, during this
same period. We supply Windows, our primary Windows Division product, to customers through our U.S. regional
operating center, while we supply the Microsoft Office System, our primary MBD product, and our Server and Tools
products to customers through our foreign regional operations centers. In fiscal years 2013 and 2012, our U.S. income
before income taxes was $6.7 billion and $1.6 billion, respectively, and comprised 25% and 7%, respectively, of our
income before income taxes. In fiscal years 2013 and 2012, the foreign income before income taxes was $20.4 billion and
$20.7 billion, respectively, and comprised 75% and 93%, respectively, of our income before income taxes. The primary
driver for the increase in the U.S. income before income tax in fiscal year 2013 was the goodwill impairment charge
recorded during the prior year.
Tax contingencies and other tax liabilities were $9.4 billion and $7.6 billion as of June 30, 2013 and 2012, respectively,
and are included in other long-term liabilities. This increase relates primarily to transfer pricing, including transfer pricing
developments in certain foreign tax jurisdictions, primarily Denmark. While we settled a portion of the I.R.S. audit for tax
years 2004 to 2006 during the third quarter of fiscal year 2011, we remain under audit for those years. In February 2012,
the I.R.S. withdrew its 2011 Revenue Agents Report and reopened the audit phase of the