Microsoft 2013 Annual Report Download - page 4
Download and view the complete annual report
Please find page 4 of the 2013 Microsoft annual report below. You can navigate through the pages in the report by either clicking on the pages listed below, or by using the keyword search tool below to find specific information within the annual report.-
 1
1 -
 2
2 -
 3
3 -
 4
4 -
 5
5 -
 6
6 -
 7
7 -
 8
8 -
 9
9 -
 10
10 -
 11
11 -
 12
12 -
 13
13 -
 14
14 -
 15
15 -
16
-
17
-
18
-
19
-
20
-
21
-
22
-
23
-
24
-
25
-
26
-
27
-
28
-
29
-
30
-
31
-
32
-
33
-
34
-
35
-
36
-
37
-
38
-
39
-
40
-
41
-
42
-
43
-
44
-
45
-
46
-
47
-
48
-
49
-
50
-
51
-
52
-
53
-
54
-
55
-
56
-
57
-
58
-
59
-
60
-
61
-
62
-
63
-
64
-
65
-
66
-
67
-
68
-
69
-
70
-
71
-
72
-
73
-
74
-
75
-
76
-
77
-
78
-
79
-
80
-
81
-
82
-
83
-
84
-
85
-
86
-
87
 |
 |

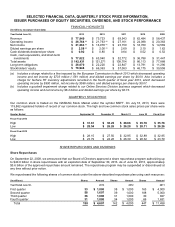
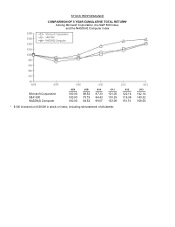
SELECTED FINANCIAL DATA, QUARTERLY STOCK PRICE INFORMATION,
ISSUER PURCHASES OF EQUITY SECURITIES, DIVIDENDS, AND STOCK PERFORMANCE
FINANCIAL HIGHLIGHTS
(In millions, except per share data)
Year Ended June 30,
2013
2012
2011
2010
2009
Revenue
$ 77,849
$ 73,723
$ 69,943
$ 62,484
$ 58,437
Operating income
$ 26,764
(a)
$ 21,763
(b)
$ 27,161
$ 24,098
$ 20,363
Net income
$ 21,863
(a)
$ 16,978
(b)
$ 23,150
$ 18,760
$ 14,569
Diluted earnings per share
$ 2.58
(a)
$ 2.00
(b)
$ 2.69
$ 2.10
$ 1.62
Cash dividends declared per share
$ 0.92
$ 0.80
$ 0.64
$ 0.52
$ 0.52
Cash, cash equivalents, and short-term
investments
$ 77,022
$ 63,040
$ 52,772
$ 36,788
$ 31,447
Total assets
$
142,431
$ 121,271
$ 108,704
$ 86,113
$ 77,888
Long-term obligations
$ 26,070
$ 22,220
$ 22,847
$ 13,791
$ 11,296
Stockholders’ equity
$ 78,944
$ 66,363
$ 57,083
$ 46,175
$ 39,558
(a) Includes a charge related to a fine imposed by the European Commission in March 2013 which decreased operating
income and net income by $733 million (€561 million) and diluted earnings per share by $0.09. Also includes a
charge for Surface RT inventory adjustments recorded in the fourth quarter of fiscal year 2013, which decreased
operating income by $900 million, net income by $596 million, and diluted earnings per share by $0.07.
(b) Includes a goodwill impairment charge related to our Online Services Division business segment which decreased
operating income and net income by $6.2 billion and diluted earnings per share by $0.73.
QUARTERLY STOCK PRICE
Our common stock is traded on the NASDAQ Stock Market under the symbol MSFT. On July 18, 2013, there were
119,862 registered holders of record of our common stock. The high and low common stock sales prices per share were
as follows:
Quarter Ended
September 30
December 31
March 31
June 30
Fiscal Year
Fiscal Year 2013
High
$ 31.61
$ 30.25
$ 28.66
$ 35.78
$ 35.78
Low
$ 28.54
$ 26.26
$ 26.28
$ 28.11
$ 26.26
Fiscal Year 2012
High
$ 28.15
$ 27.50
$ 32.95
$ 32.89
$ 32.95
Low
$ 23.79
$ 24.26
$ 26.39
$ 28.32
$ 23.79
SHARE REPURCHASES AND DIVIDENDS
Share Repurchases
On September 22, 2008, we announced that our Board of Directors approved a share repurchase program authorizing up
to $40.0 billion in share repurchases with an expiration date of September 30, 2013. As of June 30, 2013, approximately
$3.6 billion of the approved repurchase amount remained. The repurchase program may be suspended or discontinued at
any time without prior notice.
We repurchased the following shares of common stock under the above-described repurchase plan using cash resources:
(In millions)
Shares
Amount
Shares
Amount
Shares
Amount
Year Ended June 30,
2013
2012
2011
First quarter
33
$ 1,000
38
$ 1,000
163
$ 4,000
Second quarter
58
1,607
39
1,000
188
5,000
Third quarter
36
1,000
31
1,000
30
827
Fourth quarter
31
1,000
34
1,000
66
1,631
Total
158
$ 4,607
142
$ 4,000
447
$ 11,458