Microsoft 2013 Annual Report Download - page 55
Download and view the complete annual report
Please find page 55 of the 2013 Microsoft annual report below. You can navigate through the pages in the report by either clicking on the pages listed below, or by using the keyword search tool below to find specific information within the annual report.-
 1
1 -
2
-
3
-
4
-
5
-
6
-
7
-
8
-
9
-
10
-
11
-
12
-
13
-
14
-
15
-
16
-
17
-
18
-
19
-
20
-
21
-
22
-
23
-
24
-
25
-
26
-
27
-
28
-
29
-
30
-
31
-
32
-
33
-
34
-
35
-
36
-
37
-
38
-
39
-
40
-
41
-
42
-
43
-
44
-
 45
45 -
 46
46 -
 47
47 -
 48
48 -
 49
49 -
 50
50 -
 51
51 -
 52
52 -
 53
53 -
 54
54 -
 55
55 -
 56
56 -
 57
57 -
 58
58 -
 59
59 -
 60
60 -
 61
61 -
 62
62 -
 63
63 -
 64
64 -
 65
65 -
66
-
67
-
68
-
69
-
70
-
71
-
72
-
73
-
74
-
75
-
76
-
77
-
78
-
79
-
80
-
81
-
82
-
83
-
84
-
85
-
86
-
87
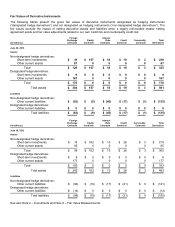
 |
 |

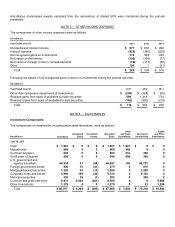
(In millions)
Cost Basis
Unrealized
Gains
Unrealized
Losses
Recorded
Basis
Cash
and Cash
Equivalents
Short-term
Investments
Equity
and Other
Investments
June 30, 2012
Cash
$ 2,019
$ 0
$ 0
$ 2,019
$ 2,019
$ 0
$ 0
Mutual funds
820
0
0
820
820
0
0
Commercial paper
96
0
0
96
96
0
0
Certificates of deposit
744
0
0
744
342
402
0
U.S. government and
agency securities
47,178
130
(2)
47,306
561
46,745
0
Foreign government bonds
1,741
18
(29)
1,730
575
1,155
0
Mortgage-backed securities
1,816
82
(2)
1,896
0
1,896
0
Corporate notes and bonds
7,799
224
(15)
8,008
2,525
5,483
0
Municipal securities
358
58
(0)
416
0
416
0
Common and preferred
stock
6,965
2,204
(436)
8,733
0
0
8,733
Other investments
1,048
0
0
1,048
0
5
1,043
Total
$ 70,584
$ 2,716
$ (484)
$ 72,816
$ 6,938
$ 56,102
$ 9,776
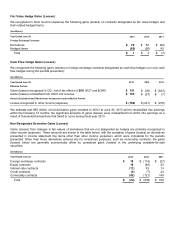
Unrealized Losses on Investments
Investments with continuous unrealized losses for less than 12 months and 12 months or greater and their related fair
values were as follows:
Less than 12 Months
12 Months or Greater
Total
Unrealized
Losses
(In millions)
Fair Value
Unrealized
Losses
Fair Value
Unrealized
Losses
Total
Fair Value
June 30, 2013
U.S. government and agency securities
$ 2,208
$ (84)
$ 0
$ 0
$ 2,208
$ (84)
Foreign government bonds
589
(18)
69
(23)
658
(41)
Mortgage-backed securities
357
(12)
39
(1)
396
(13)
Corporate notes and bonds
1,142
(38)
27
(2)
1,169
(40)
Municipal securities
44
(1)
0
0
44
(1)
Common and preferred stock
1,166
(168)
409
(113)
1,575
(281)
Total
$ 5,506
$ (321)
$ 544
$ (139)
$ 6,050
$ (460)
Less than 12 Months
12 Months or Greater
Total
Unrealized
Losses
(In millions)
Fair Value
Unrealized
Losses
Fair Value
Unrealized
Losses
Total
Fair Value
June 30, 2012
U.S. government and agency securities
$ 44
$ (2)
$ 0
$ 0
$ 44
$ (2)
Foreign government bonds
657
(27)
12
(2)
669
(29)
Mortgage-backed securities
53
0
48
(2)
101
(2)
Corporate notes and bonds
640
(11)
70
(4)
710
(15)
Common and preferred stock
2,135
(329)
305
(107)
2,440
(436)
Total
$ 3,529
$ (369)
$ 435
$ (115)
$
3,964
$ (484)
Unrealized losses from fixed-income securities are primarily attributable to changes in interest rates. Unrealized losses
from domestic and international equities are due to market price movements. Management does not believe any
remaining unrealized losses represent other-than-temporary impairments based on our evaluation of available evidence
as of June 30, 2013.