Microsoft 2013 Annual Report Download - page 81
Download and view the complete annual report
Please find page 81 of the 2013 Microsoft annual report below. You can navigate through the pages in the report by either clicking on the pages listed below, or by using the keyword search tool below to find specific information within the annual report.-
 1
1 -
2
-
3
-
4
-
5
-
6
-
7
-
8
-
9
-
10
-
11
-
12
-
13
-
14
-
15
-
16
-
17
-
18
-
19
-
20
-
21
-
22
-
23
-
24
-
25
-
26
-
27
-
28
-
29
-
30
-
31
-
32
-
33
-
34
-
35
-
36
-
37
-
38
-
39
-
40
-
41
-
42
-
43
-
44
-
45
-
46
-
47
-
48
-
49
-
50
-
51
-
52
-
53
-
54
-
55
-
56
-
57
-
58
-
59
-
60
-
61
-
62
-
63
-
64
-
65
-
66
-
67
-
68
-
69
-
70
-
 71
71 -
 72
72 -
 73
73 -
 74
74 -
 75
75 -
 76
76 -
 77
77 -
 78
78 -
 79
79 -
 80
80 -
 81
81 -
 82
82 -
 83
83 -
 84
84 -
 85
85 -
 86
86 -
 87
87
 |
 |

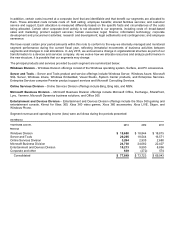
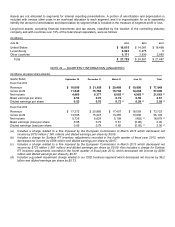
Assets are not allocated to segments for internal reporting presentations. A portion of amortization and depreciation is
included with various other costs in an overhead allocation to each segment, and it is impracticable for us to separately
identify the amount of amortization and depreciation by segment that is included in the measure of segment profit or loss.
Long-lived assets, excluding financial instruments and tax assets, classified by the location of the controlling statutory
company and with countries over 10% of the total shown separately, were as follows:
(In millions)
June 30,
2013
2012
2011
United States
$ 16,615
$ 14,081
$ 18,498
Luxembourg
6,943
6,975
0
Other countries
4,171
3,835
2,989
Total
$ 27,729
$ 24,891
$ 21,487
NOTE 22 — QUARTERLY INFORMATION (UNAUDITED)
(In millions, except per share amounts)
Quarter Ended
September 30
December 31
March 31
June 30
Total
Fiscal Year 2013
Revenue
$ 16,008
$ 21,456
$ 20,489
$ 19,896
$ 77,849
Gross profit
11,840
15,764
15,702
14,294
57,600
Net income
4,466
6,377
6,055 (a)
4,965 (b)
21,863 (c)
Basic earnings per share
0.53
0.76
0.72
0.59
2.61
Diluted earnings per share
0.53
0.76
0.72
(a)
0.59
(b)
2.58
(c)
Fiscal Year 2012
Revenue
$ 17,372
$ 20,885
$ 17,407
$ 18,059
$ 73,723
Gross profit
13,595
15,247
13,455
13,896
56,193
Net income
5,738
6,624
5,108
(492)
(d)
16,978
(d)
Basic earnings (loss) per share
0.68
0.79
0.61
(0.06)
2.02
Diluted earnings (loss) per share
0.68
0.78
0.60
(0.06)
(d)
2.00
(d)
(a) Includes a charge related to a fine imposed by the European Commission in March 2013 which decreased net
income by $733 million (€561 million) and diluted earnings per share by $0.09.
(b) Includes a charge for Surface RT inventory adjustments recorded in the fourth quarter of fiscal year 2013, which
decreased net income by $596 million and diluted earnings per share by $0.07.
(c) Includes a charge related to a fine imposed by the European Commission in March 2013 which decreased net
income by $733 million (€561 million) and diluted earnings per share by $0.09. Also includes a charge for Surface
RT inventory adjustments recorded in the fourth quarter of fiscal year 2013, which decreased net income by $596
million and diluted earnings per share by $0.07.
(d) Includes a goodwill impairment charge related to our OSD business segment which decreased net income by $6.2
billion and diluted earnings per share by $0.73.