Microsoft 2013 Annual Report Download - page 24
Download and view the complete annual report
Please find page 24 of the 2013 Microsoft annual report below. You can navigate through the pages in the report by either clicking on the pages listed below, or by using the keyword search tool below to find specific information within the annual report.-
 1
1 -
2
-
3
-
4
-
5
-
6
-
7
-
8
-
9
-
10
-
11
-
12
-
13
-
 14
14 -
 15
15 -
 16
16 -
 17
17 -
 18
18 -
 19
19 -
 20
20 -
 21
21 -
 22
22 -
 23
23 -
 24
24 -
 25
25 -
 26
26 -
 27
27 -
 28
28 -
 29
29 -
 30
30 -
 31
31 -
 32
32 -
 33
33 -
 34
34 -
35
-
36
-
37
-
38
-
39
-
40
-
41
-
42
-
43
-
44
-
45
-
46
-
47
-
48
-
49
-
50
-
51
-
52
-
53
-
54
-
55
-
56
-
57
-
58
-
59
-
60
-
61
-
62
-
63
-
64
-
65
-
66
-
67
-
68
-
69
-
70
-
71
-
72
-
73
-
74
-
75
-
76
-
77
-
78
-
79
-
80
-
81
-
82
-
83
-
84
-
85
-
86
-
87
 |
 |

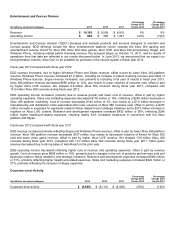
Microsoft Business Division
(In millions, except percentages)
2013
2012
2011
Percentage
Change 2013
Versus 2012
Percentage
Change
2012
Versus 2011
Revenue
$ 24,724
$ 24,111
$ 22,607
3%
7%
Operating income
$ 16,194
$ 15,832
$ 14,678
2%
8%
Microsoft Business Division (“MBD”) develops and markets software and online services designed to increase personal,
team, and organization productivity. MBD offerings include the Microsoft Office system (“Office,” comprising mainly the
core Office product set, Office 365, SharePoint, Exchange, and Lync), which generates over 90% of MBD revenue, and
Microsoft Dynamics business solutions. The general availability of the new Office started on January 29, 2013.
We evaluate MBD results based upon the nature of the end user in two primary parts: business revenue and consumer
revenue. Business revenue includes Office revenue generated through subscription and volume licensing agreements
with software assurance, license-only agreements for Office, and Microsoft Dynamics revenue. Consumer revenue
includes revenue from retail packaged product sales and OEM revenue.
Fiscal year 2013 compared with fiscal year 2012
MBD revenue increased reflecting growth in business revenue, partially offset by a decline in consumer revenue.
Business revenue increased $1.2 billion or 6%, which reflects 11% growth in Office revenue from subscriptions and
volume licensing agreements with software assurance, and a 12% increase in Microsoft Dynamics revenue, offset in part
by a 9% decrease in Office license-only revenue. Consumer revenue decreased $582 million or 13%, primarily driven by
the impact on revenue of a decline in the x86 PC market.
MBD revenue for the year ended June 30, 2013 included an unfavorable foreign currency impact of $475 million.
MBD operating income increased, primarily due to revenue growth, offset in part by higher sales and marketing expenses
and cost of revenue. Sales and marketing expenses grew $185 million or 5%, primarily due to higher advertising
expenses, fees paid to third-party software advisors, and increased cross-platform marketing activities. Cost of revenue
grew $108 million or 6%, primarily due to an increase in online operation and support costs.
Fiscal year 2012 compared with fiscal year 2011
MBD revenue increased primarily reflecting sales of Office. Business revenue increased $1.7 billion or 9%, primarily
reflecting growth in multi-year volume licensing revenue, licensing of Office to transactional business customers, and a
9% increase in Microsoft Dynamics revenue. Consumer revenue decreased $193 million or 4% due to the recognition of
$254 million of revenue in the prior year associated with the 2010 Office Upgrade Offer. Excluding the fiscal year 2011
impact associated with the 2010 Office Upgrade Offer, consumer revenue increased $61 million, driven by increased
sales of Office.
MBD revenue for the year ended June 30, 2012 included a favorable foreign currency impact of $506 million.
MBD operating income increased, primarily due to revenue growth, offset in part by higher cost of revenue and research
and development expenses. Cost of revenue increased $278 million or 17%, primarily due to higher online operation and
support costs. Research and development expenses increased, due mainly to an increase in headcount-related
expenses.