Microsoft 2013 Annual Report Download - page 79
Download and view the complete annual report
Please find page 79 of the 2013 Microsoft annual report below. You can navigate through the pages in the report by either clicking on the pages listed below, or by using the keyword search tool below to find specific information within the annual report.-
 1
1 -
2
-
3
-
4
-
5
-
6
-
7
-
8
-
9
-
10
-
11
-
12
-
13
-
14
-
15
-
16
-
17
-
18
-
19
-
20
-
21
-
22
-
23
-
24
-
25
-
26
-
27
-
28
-
29
-
30
-
31
-
32
-
33
-
34
-
35
-
36
-
37
-
38
-
39
-
40
-
41
-
42
-
43
-
44
-
45
-
46
-
47
-
48
-
49
-
50
-
51
-
52
-
53
-
54
-
55
-
56
-
57
-
58
-
59
-
60
-
61
-
62
-
63
-
64
-
65
-
66
-
67
-
68
-
 69
69 -
 70
70 -
 71
71 -
 72
72 -
 73
73 -
 74
74 -
 75
75 -
 76
76 -
 77
77 -
 78
78 -
 79
79 -
 80
80 -
 81
81 -
 82
82 -
 83
83 -
 84
84 -
 85
85 -
 86
86 -
 87
87
 |
 |

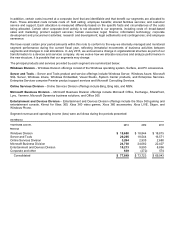
In addition, certain costs incurred at a corporate level that are identifiable and that benefit our segments are allocated to
them. These allocated costs include costs of: field selling; employee benefits; shared facilities services; and customer
service and support. Each allocation is measured differently based on the specific facts and circumstances of the costs
being allocated. Certain other corporate-level activity is not allocated to our segments, including costs of: broad-based
sales and marketing; product support services; human resources; legal; finance; information technology; corporate
development and procurement activities; research and development; legal settlements and contingencies; and employee
severance.
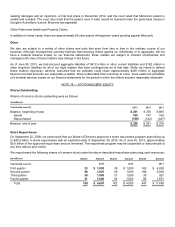
We have recast certain prior period amounts within this note to conform to the way we internally managed and monitored
segment performance during the current fiscal year, reflecting immaterial movements of business activities between
segments and changes in cost allocations. In July 2013, we announced a change in organizational structure as part of our
transformation to a devices and services company. As we evolve how we allocate resources and analyze performance in
the new structure, it is possible that our segments may change.
The principal products and services provided by each segment are summarized below:
Windows Division – Windows Division offerings consist of the Windows operating system, Surface, and PC accessories.
Server and Tools – Server and Tools product and service offerings include Windows Server, Windows Azure, Microsoft
SQL Server, Windows Intune, Windows Embedded, Visual Studio, System Center products, and Enterprise Services.
Enterprise Services comprise Premier product support services and Microsoft Consulting Services.
Online Services Division – Online Services Division offerings include Bing, Bing Ads, and MSN.
Microsoft Business Division – Microsoft Business Division offerings include Microsoft Office, Exchange, SharePoint,
Lync, Yammer, Microsoft Dynamics business solutions, and Office 365.
Entertainment and Devices Division – Entertainment and Devices Division offerings include the Xbox 360 gaming and
entertainment console, Kinect for Xbox 360, Xbox 360 video games, Xbox 360 accessories, Xbox LIVE, Skype, and
Windows Phone.
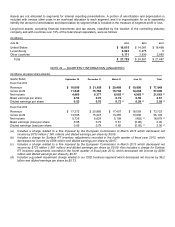
Segment revenue and operating income (loss) were as follows during the periods presented:
(In millions)
Year Ended June 30,
2013
2012
2011
Revenue
Windows Division
$ 18,680
$ 18,844
$ 18,815
Server and Tools
20,295
18,544
16,571
Online Services Division
3,284
2,935
2,680
Microsoft Business Division
24,738
24,082
22,407
Entertainment and Devices Division
10,213
9,590
8,896
Corporate and other
639
(272)
574
Consolidated
$ 77,849
$ 73,723
$ 69,943