Microsoft 2013 Annual Report Download - page 34
Download and view the complete annual report
Please find page 34 of the 2013 Microsoft annual report below. You can navigate through the pages in the report by either clicking on the pages listed below, or by using the keyword search tool below to find specific information within the annual report.-
 1
1 -
2
-
3
-
4
-
5
-
6
-
7
-
8
-
9
-
10
-
11
-
12
-
13
-
14
-
15
-
16
-
17
-
18
-
19
-
20
-
21
-
22
-
23
-
 24
24 -
 25
25 -
 26
26 -
 27
27 -
 28
28 -
 29
29 -
 30
30 -
 31
31 -
 32
32 -
 33
33 -
 34
34 -
 35
35 -
 36
36 -
 37
37 -
 38
38 -
 39
39 -
 40
40 -
 41
41 -
 42
42 -
 43
43 -
 44
44 -
45
-
46
-
47
-
48
-
49
-
50
-
51
-
52
-
53
-
54
-
55
-
56
-
57
-
58
-
59
-
60
-
61
-
62
-
63
-
64
-
65
-
66
-
67
-
68
-
69
-
70
-
71
-
72
-
73
-
74
-
75
-
76
-
77
-
78
-
79
-
80
-
81
-
82
-
83
-
84
-
85
-
86
-
87
 |
 |

Share Repurchases
On September 22, 2008, we announced that our Board of Directors approved a new share repurchase program
authorizing up to $40.0 billion in share repurchases with an expiration date of September 30, 2013. As of June 30, 2013,
approximately $3.6 billion remained of the $40.0 billion approved repurchase amount. The repurchase program may be
suspended or discontinued at any time without notice.
During the periods reported, we repurchased with cash resources: 158 million shares for $4.6 billion during fiscal year
2013; 142 million shares for $4.0 billion during fiscal year 2012; and 447 million shares for $11.5 billion during fiscal year
2011.
Dividends
During fiscal years 2013 and 2012, our Board of Directors declared the following dividends:
Declaration Date
Dividend
Per Share
Record Date
Total Amount
Payment Date
(In millions)
Fiscal Year 2013
September 18, 2012
$ 0.23
November 15, 2012
$ 1,933
December 13, 2012
November 28, 2012
$ 0.23
February 21, 2013
$ 1,925
March 14, 2013
March 11, 2013
$ 0.23
May 16, 2013
$ 1,921
June 13, 2013
June 12, 2013
$ 0.23
August 15, 2013
$ 1,916
September 12, 2013
Fiscal Year 2012
September 20, 2011
$ 0.20
November 17, 2011
$ 1,683
December 8, 2011
December 14, 2011
$ 0.20
February 16, 2012
$ 1,683
March 8, 2012
March 13, 2012
$ 0.20
May 17, 2012
$ 1,678
June 14, 2012
June 13, 2012
$ 0.20
August 16, 2012
$ 1,676
September 13, 2012
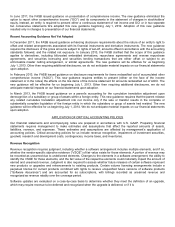
Off-Balance Sheet Arrangements
We provide indemnifications of varying scope and size to certain customers against claims of intellectual property
infringement made by third parties arising from the use of our products and certain other matters. In evaluating estimated
losses on these indemnifications, we consider factors such as the degree of probability of an unfavorable outcome and
our ability to make a reasonable estimate of the amount of loss. These obligations did not have a material impact on our
financial statements during the periods presented.
Contractual Obligations
The following table summarizes the payments due by fiscal year for our outstanding contractual obligations as of
June 30, 2013:
(In millions)
2014
2015-2016
2017-2018
Thereafter
Total
Long-term debt:
(a)
Principal payments
$ 3,000
$ 2,500
$ 1,050
$ 9,115
$ 15,665
Interest payments
459
776
693
4,940
6,868
Construction commitments
(b)
694
0
0
0
694
Operating leases (c)
572
800
485
605
2,462
Purchase commitments
(d)
13,752
934
258
83
15,027
Other long-term liabilities
(e)
0
67
20
23
110
Total contractual obligations
$ 18,477
$ 5,077
$ 2,506
$ 14,766
$ 40,826