Microsoft 2013 Annual Report Download - page 54
Download and view the complete annual report
Please find page 54 of the 2013 Microsoft annual report below. You can navigate through the pages in the report by either clicking on the pages listed below, or by using the keyword search tool below to find specific information within the annual report.-
 1
1 -
2
-
3
-
4
-
5
-
6
-
7
-
8
-
9
-
10
-
11
-
12
-
13
-
14
-
15
-
16
-
17
-
18
-
19
-
20
-
21
-
22
-
23
-
24
-
25
-
26
-
27
-
28
-
29
-
30
-
31
-
32
-
33
-
34
-
35
-
36
-
37
-
38
-
39
-
40
-
41
-
42
-
43
-
 44
44 -
 45
45 -
 46
46 -
 47
47 -
 48
48 -
 49
49 -
 50
50 -
 51
51 -
 52
52 -
 53
53 -
 54
54 -
 55
55 -
 56
56 -
 57
57 -
 58
58 -
 59
59 -
 60
60 -
 61
61 -
 62
62 -
 63
63 -
 64
64 -
65
-
66
-
67
-
68
-
69
-
70
-
71
-
72
-
73
-
74
-
75
-
76
-
77
-
78
-
79
-
80
-
81
-
82
-
83
-
84
-
85
-
86
-
87
 |
 |
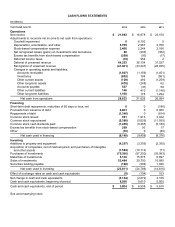
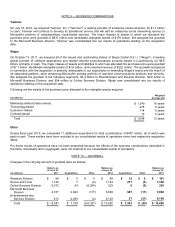
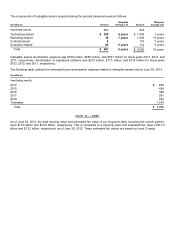
Anti-dilutive stock-based awards excluded from the calculations of diluted EPS were immaterial during the periods
presented.
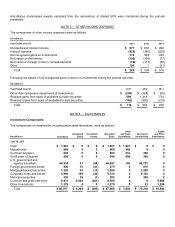
NOTE 3 — OTHER INCOME (EXPENSE)
The components of other income (expense) were as follows:
(In millions)
Year Ended June 30,
2013
2012
2011
Dividends and interest income
$ 677
$ 800
$ 900
Interest expense
(429)
(380)
(295)
Net recognized gains on investments
116
564
439
Net losses on derivatives
(196)
(364)
(77)
Net losses on foreign currency remeasurements
(74)
(117)
(26)
Other
194
1
(31)
Total
$ 288
$ 504
$ 910
Following are details of net recognized gains (losses) on investments during the periods reported:
(In millions)
Year Ended June 30,
2013
2012
2011
Other-than-temporary impairments of investments
$ (208)
$ (298)
$ (80)
Realized gains from sales of available-for-sale securities
489
1,418
734
Realized losses from sales of available-for-sale securities
(165)
(556)
(215)
Total
$ 116
$ 564
$ 439
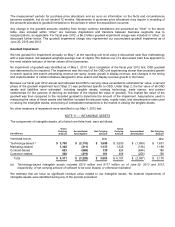
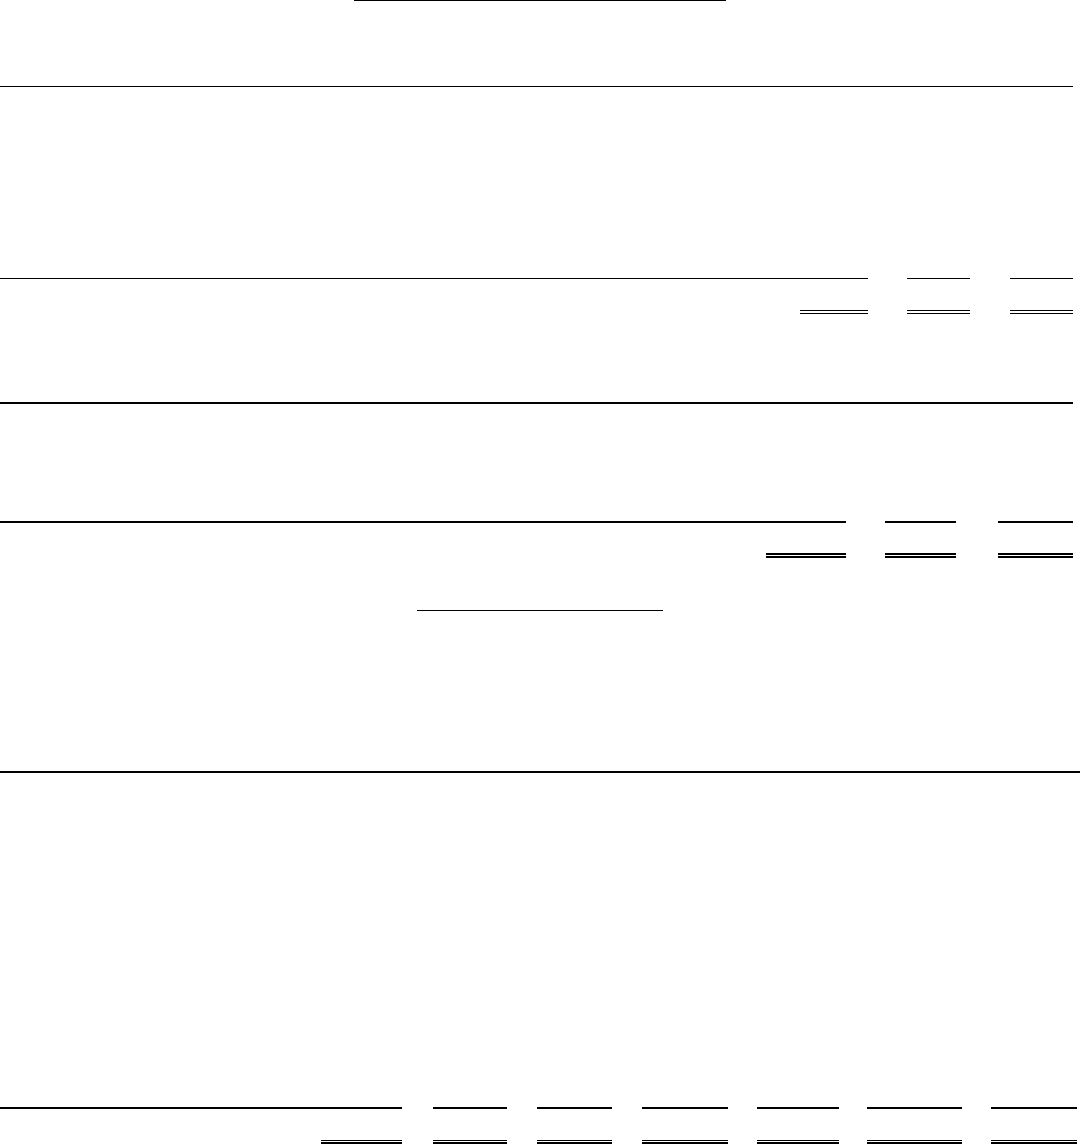
NOTE 4 — INVESTMENTS
Investment Components
The components of investments, including associated derivatives, were as follows:
(In millions)
Cost Basis
Unrealized
Gains
Unrealized
Losses
Recorded
Basis
Cash
and Cash
Equivalents
Short-term
Investments
Equity
and Other
Investments
June 30, 2013
Cash
$ 1,967
$ 0
$ 0
$ 1,967
$ 1,967
$ 0
$ 0
Mutual funds
868
0
0
868
868
0
0
Commercial paper
603
0
0
603
214
389
0
Certificates of deposit
994
0
0
994
609
385
0
U.S. government and
agency securities
64,934
47
(84)
64,897
146
64,751
0
Foreign government bonds
900
16
(41)
875
0
875
0
Mortgage-backed securities
1,258
43
(13)
1,288
0
1,288
0
Corporate notes and bonds
4,993
169
(40)
5,122
0
5,122
0
Municipal securities
350
36
(1)
385
0
385
0
Common and preferred stock
6,931
2,938
(281)
9,588
0
0
9,588
Other investments
1,279
0
0
1,279
0
23
1,256
Total
$ 85,077
$ 3,249
$ (460)
$ 87,866
$ 3,804
$ 73,218
$ 10,844