Microsoft 2013 Annual Report Download - page 63
Download and view the complete annual report
Please find page 63 of the 2013 Microsoft annual report below. You can navigate through the pages in the report by either clicking on the pages listed below, or by using the keyword search tool below to find specific information within the annual report.-
 1
1 -
2
-
3
-
4
-
5
-
6
-
7
-
8
-
9
-
10
-
11
-
12
-
13
-
14
-
15
-
16
-
17
-
18
-
19
-
20
-
21
-
22
-
23
-
24
-
25
-
26
-
27
-
28
-
29
-
30
-
31
-
32
-
33
-
34
-
35
-
36
-
37
-
38
-
39
-
40
-
41
-
42
-
43
-
44
-
45
-
46
-
47
-
48
-
49
-
50
-
51
-
52
-
 53
53 -
 54
54 -
 55
55 -
 56
56 -
 57
57 -
 58
58 -
 59
59 -
 60
60 -
 61
61 -
 62
62 -
 63
63 -
 64
64 -
 65
65 -
 66
66 -
 67
67 -
 68
68 -
 69
69 -
 70
70 -
 71
71 -
 72
72 -
 73
73 -
74
-
75
-
76
-
77
-
78
-
79
-
80
-
81
-
82
-
83
-
84
-
85
-
86
-
87
 |
 |

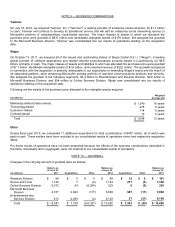
The measurement periods for purchase price allocations end as soon as information on the facts and circumstances
becomes available, but do not exceed 12 months. Adjustments in purchase price allocations may require a recasting of
the amounts allocated to goodwill retroactive to the periods in which the acquisitions occurred.
Any change in the goodwill amounts resulting from foreign currency translations are presented as “other” in the above
table. Also included within “other” are business dispositions and transfers between business segments due to
reorganizations, as applicable. For fiscal year 2012, a $6.2 billion goodwill impairment charge was included in “other,” as
discussed further below. This goodwill impairment charge also represented our accumulated goodwill impairment as of
June 30, 2013 and 2012.
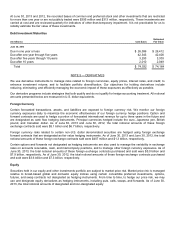
Goodwill Impairment
We test goodwill for impairment annually on May 1 at the reporting unit level using a discounted cash flow methodology
with a peer-based, risk-adjusted weighted average cost of capital. We believe use of a discounted cash flow approach is
the most reliable indicator of the fair values of the businesses.
No impairment of goodwill was identified as of May 1, 2013. Upon completion of the fiscal year 2012 test, OSD goodwill
was determined to be impaired. The impairment was the result of the OSD unit experiencing slower than projected growth
in search queries and search advertising revenue per query, slower growth in display revenue, and changes in the timing
and implementation of certain initiatives designed to drive search and display revenue growth in the future.
Because our fiscal year 2012 annual test indicated that OSD’s carrying value exceeded its estimated fair value, a second
phase of the goodwill impairment test (“Step 2”) was performed specific to OSD. Under Step 2, the fair value of all OSD
assets and liabilities were estimated, including tangible assets, existing technology, trade names, and partner
relationships for the purpose of deriving an estimate of the implied fair value of goodwill. The implied fair value of the
goodwill was then compared to the recorded goodwill to determine the amount of the impairment. Assumptions used in
measuring the value of these assets and liabilities included the discount rates, royalty rates, and obsolescence rates used
in valuing the intangible assets, and pricing of comparable transactions in the market in valuing the tangible assets.
No other instances of impairment were identified in our May 1, 2012 test.
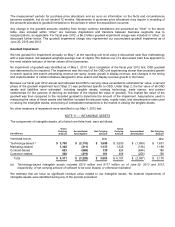
NOTE 11 — INTANGIBLE ASSETS
The components of intangible assets, all of which are finite-lived, were as follows:
(In millions)
Gross
Carrying
Amount
Accumulated
Amortization
Net Carrying
Amount
Gross
Carrying
Amount
Accumulated
Amortization
Net Carrying
Amount
Year Ended June 30,
2013
2012
Technology-based (a)
$ 3,760
$ (2,110)
$ 1,650
$ 3,550
$ (1,899)
$ 1,651
Marketing-related
1,348
(211)
1,137
1,325
(136)
1,189
Contract-based
823
(688)
135
824
(644)
180
Customer-related
380
(219)
161
408
(258)
150
Total
$ 6,311
$ (3,228)
$ 3,083
$ 6,107
$ (2,937)
$ 3,170
(a) Technology-based intangible assets included $218 million and $177 million as of June 30, 2013 and 2012,
respectively, of net carrying amount of software to be sold, leased, or otherwise marketed.
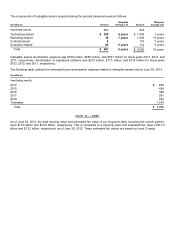
We estimate that we have no significant residual value related to our intangible assets. No material impairments of
intangible assets were identified during any of the periods presented.