Microsoft 2013 Annual Report Download - page 30
Download and view the complete annual report
Please find page 30 of the 2013 Microsoft annual report below. You can navigate through the pages in the report by either clicking on the pages listed below, or by using the keyword search tool below to find specific information within the annual report.-
 1
1 -
2
-
3
-
4
-
5
-
6
-
7
-
8
-
9
-
10
-
11
-
12
-
13
-
14
-
15
-
16
-
17
-
18
-
19
-
 20
20 -
 21
21 -
 22
22 -
 23
23 -
 24
24 -
 25
25 -
 26
26 -
 27
27 -
 28
28 -
 29
29 -
 30
30 -
 31
31 -
 32
32 -
 33
33 -
 34
34 -
 35
35 -
 36
36 -
 37
37 -
 38
38 -
 39
39 -
 40
40 -
41
-
42
-
43
-
44
-
45
-
46
-
47
-
48
-
49
-
50
-
51
-
52
-
53
-
54
-
55
-
56
-
57
-
58
-
59
-
60
-
61
-
62
-
63
-
64
-
65
-
66
-
67
-
68
-
69
-
70
-
71
-
72
-
73
-
74
-
75
-
76
-
77
-
78
-
79
-
80
-
81
-
82
-
83
-
84
-
85
-
86
-
87
 |
 |

examination. As of June 30, 2013, the primary unresolved issue relates to transfer pricing which could have a significant
impact on our financial statements if not resolved favorably. We do not believe it is reasonably possible that the total
amount of unrecognized tax benefits will significantly increase or decrease within the next 12 months because we do not
believe the remaining open issues will be resolved within the next 12 months. We also continue to be subject to
examination by the I.R.S. for tax years 2007 to 2012.
We are subject to income tax in many jurisdictions outside the U.S. Our operations in certain jurisdictions remain subject
to examination for tax years 1996 to 2012, some of which are currently under audit by local tax authorities. The
resolutions of these audits are not expected to be material to our financial statements.
Fiscal year 2012 compared with fiscal year 2011
Our effective tax rates for fiscal years 2012 and 2011 were approximately 24% and 18%, respectively. Our effective tax
rates were lower than the U.S. federal statutory rate primarily due to earnings taxed at lower rates in foreign jurisdictions
resulting from producing and distributing our products and services through our foreign regional operations centers in
Ireland, Singapore, and Puerto Rico.
Our fiscal year 2012 effective rate increased by 6% from fiscal year 2011 mainly due to a nonrecurring $6.2 billion non-tax
deductible goodwill impairment charge that was recorded in the fourth quarter of 2012. The goodwill impairment charge
increased our effective tax rate by 10%. In addition, in fiscal years 2012 and 2011, we recognized a reduction of 21% and
16%, respectively, to the effective tax rate due to foreign earnings taxed at lower rates. In fiscal year 2011, we settled a
portion of an I.R.S. audit of tax years 2004 to 2006, which reduced our income tax expense for fiscal year 2011 by $461
million and reduced the effective tax rate by 2%.
Changes in the mix of income before income taxes between the U.S. and foreign countries also impacted our effective tax
rates and resulted primarily from changes in the geographic distribution of and changes in consumer demand for our
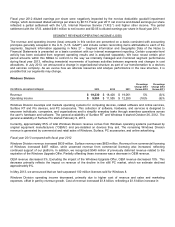
products and services. As discussed above, Windows Division operating income declined $751 million in fiscal year 2012,
while MBD and Server and Tools operating income increased $1.1 billion and $1.1 billion, respectively, during this same
period. We supply Windows, our primary Windows Division product, to customers through our U.S. regional operating
center, while we supply the Microsoft Office System, our primary MBD product, and our Server and Tools products to
customers through our foreign regional operations centers. In fiscal years 2012 and 2011, our U.S. income before income
taxes was $1.6 billion and $8.9 billion, respectively, and comprised 7% and 32%, respectively, of our income before
income taxes. In fiscal years 2012 and 2011, the foreign income before income taxes was $20.7 billion and $19.2 billion,
respectively, and comprised 93% and 68%, respectively, of our income before income taxes. The primary driver for the
decrease in the U.S. income before income tax in fiscal year 2012 was the goodwill impairment charge.
FINANCIAL CONDITION
Cash, Cash Equivalents, and Investments
Cash, cash equivalents, and short-term investments totaled $77.0 billion as of June 30, 2013, compared with $63.0 billion
as of June 30, 2012. Equity and other investments were $10.8 billion as of June 30, 2013, compared with $9.8 billion as of
June 30, 2012. Our short-term investments are primarily to facilitate liquidity and for capital preservation. They consist
predominantly of highly liquid investment-grade fixed-income securities, diversified among industries and individual
issuers. The investments are predominantly U.S. dollar-denominated securities, but also include foreign currency-
denominated securities in order to diversify risk. Our fixed-income investments are exposed to interest rate risk and credit
risk. The credit risk and average maturity of our fixed-income portfolio are managed to achieve economic returns that
correlate to certain fixed-income indices. The settlement risk related to these investments is insignificant given that the
short-term investments held are primarily highly liquid investment-grade fixed-income securities. While we own certain
mortgage-backed and asset-backed fixed-income securities, our portfolio as of June 30, 2013 does not contain material
direct exposure to subprime mortgages or structured vehicles that derive their value from subprime collateral. The majority
of our mortgage-backed securities are collateralized by prime residential mortgages and carry a 100% principal and
interest guarantee, primarily from Federal National Mortgage Association, Federal Home Loan Mortgage Corporation, and
Government National Mortgage Association.