Microsoft 2013 Annual Report Download - page 80
Download and view the complete annual report
Please find page 80 of the 2013 Microsoft annual report below. You can navigate through the pages in the report by either clicking on the pages listed below, or by using the keyword search tool below to find specific information within the annual report.-
 1
1 -
2
-
3
-
4
-
5
-
6
-
7
-
8
-
9
-
10
-
11
-
12
-
13
-
14
-
15
-
16
-
17
-
18
-
19
-
20
-
21
-
22
-
23
-
24
-
25
-
26
-
27
-
28
-
29
-
30
-
31
-
32
-
33
-
34
-
35
-
36
-
37
-
38
-
39
-
40
-
41
-
42
-
43
-
44
-
45
-
46
-
47
-
48
-
49
-
50
-
51
-
52
-
53
-
54
-
55
-
56
-
57
-
58
-
59
-
60
-
61
-
62
-
63
-
64
-
65
-
66
-
67
-
68
-
69
-
 70
70 -
 71
71 -
 72
72 -
 73
73 -
 74
74 -
 75
75 -
 76
76 -
 77
77 -
 78
78 -
 79
79 -
 80
80 -
 81
81 -
 82
82 -
 83
83 -
 84
84 -
 85
85 -
 86
86 -
 87
87
 |
 |

(In millions)
Year Ended June 30,
2013
2012
2011
Operating Income (Loss)
Windows Division
$ 8,943
$ 12,005
$ 12,040
Server and Tools
8,152
7,256
6,132
Online Services Division
(1,298)
(8,117)
(2,649)
Microsoft Business Division
16,189
15,803
14,467
Entertainment and Devices Division
888
381
1,299
Corporate and other
(6,110)
(5,565)
(4,128)
Consolidated
$ 26,764
$ 21,763
$ 27,161
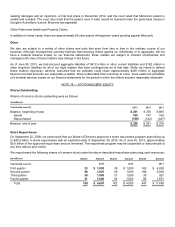
Reconciling amounts in the tables above and below include adjustments to conform our internal accounting policies to
U.S. GAAP and corporate-level activity not specifically attributed to a segment. Significant internal accounting policies that
differ from U.S. GAAP relate to revenue recognition, income statement classification, and depreciation.
Significant reconciling items were as follows:
(In millions)
Year Ended June 30,
2013
2012
2011
Corporate-level activity
(a)
$ (6,665)
$ (5,114)
$ (4,506)
Revenue reconciling amounts (b)
400
(484)
380
Other
155
33
(2)
Total
$ (6,110)
$ (5,565)
$ (4,128)
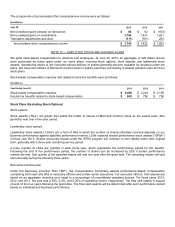
(a) Corporate-level activity excludes revenue reconciling amounts presented separately in that line item.
(b) Revenue reconciling amounts for fiscal year 2012 and 2013 include the deferral and subsequent recognition,
respectively, of $540 million of revenue related to the Windows Upgrade Offer.
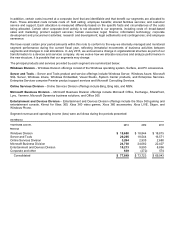
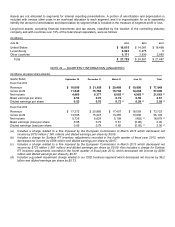
No sales to an individual customer or country other than the United States accounted for more than 10% of fiscal year
2013, 2012, or 2011 revenue. Revenue, classified by the major geographic areas in which our customers are located, was
as follows:
(In millions)
Year Ended June 30,
2013
2012
2011
United States
(a)
$ 41,344
$ 38,846
$
38,008
Other countries
36,505
34,877
31,935
Total
$ 77,849
$ 73,723
$ 69,943
(a) Includes billings to OEMs and certain multinational organizations because of the nature of these businesses and the
impracticability of determining the geographic source of the revenue.
Revenue from external customers, classified by significant product and service offerings were as follows:
(In millions)
Year Ended June 30,
2013
2012
2011
Microsoft Office system
$ 22,995
$ 22,299
$ 20,730
Windows operating systems for computing devices
17,529
17,320
17,825
Server products and tools
15,408
14,232
13,251
Xbox 360 platform
7,100
8,045
8,103
Consulting and product support services
4,372
3,976
3,372
Advertising
3,387
3,181
2,913
Other
7,058
4,670
3,749
Total
$ 77,849
$ 73,723
$ 69,943