Microsoft 2013 Annual Report Download - page 60
Download and view the complete annual report
Please find page 60 of the 2013 Microsoft annual report below. You can navigate through the pages in the report by either clicking on the pages listed below, or by using the keyword search tool below to find specific information within the annual report.-
 1
1 -
2
-
3
-
4
-
5
-
6
-
7
-
8
-
9
-
10
-
11
-
12
-
13
-
14
-
15
-
16
-
17
-
18
-
19
-
20
-
21
-
22
-
23
-
24
-
25
-
26
-
27
-
28
-
29
-
30
-
31
-
32
-
33
-
34
-
35
-
36
-
37
-
38
-
39
-
40
-
41
-
42
-
43
-
44
-
45
-
46
-
47
-
48
-
49
-
 50
50 -
 51
51 -
 52
52 -
 53
53 -
 54
54 -
 55
55 -
 56
56 -
 57
57 -
 58
58 -
 59
59 -
 60
60 -
 61
61 -
 62
62 -
 63
63 -
 64
64 -
 65
65 -
 66
66 -
 67
67 -
 68
68 -
 69
69 -
 70
70 -
71
-
72
-
73
-
74
-
75
-
76
-
77
-
78
-
79
-
80
-
81
-
82
-
83
-
84
-
85
-
86
-
87
 |
 |

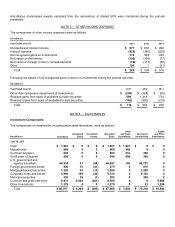
NOTE 6 — FAIR VALUE MEASUREMENTS
Assets and Liabilities Measured at Fair Value on a Recurring Basis
The following tables present the fair value of our financial instruments that are measured at fair value on a recurring basis:
(In millions)
Level 1
Level 2
Level 3
Gross
Fair
Value
Netting (a)
Net Fair
Value
June 30, 2013
Assets
Mutual funds
$ 868
$ 0
$ 0
$ 868
$ 0
$ 868
Commercial paper
0
603
0
603
0
603
Certificates of deposit
0
994
0
994
0
994
U.S. government and agency
securities
62,237
2,664
0
64,901
0
64,901
Foreign government bonds
9
851
0
860
0
860
Mortgage-backed securities
0
1,311
0
1,311
0
1,311
Corporate notes and bonds
0
4,915
19
4,934
0
4,934
Municipal securities
0
385
0
385
0
385
Common and preferred stock
8,470
717
5
9,192
0
9,192
Derivatives
12
489
0
501
(81)
420
Total
$ 71,596
$ 12,929
$ 24
$ 84,549
$ (81)
$ 84,468
Liabilities
Derivatives and other
$ 14
$ 121
$ 0
$ 135
$ (80)
$ 55
(In millions)
Level 1
Level 2
Level 3
Gross
Fair
Value
Netting
(a)
Net Fair
Value
June 30, 2012
Assets
Mutual funds
$ 820
$ 0
$ 0
$ 820
$ 0
$ 820
Commercial paper
0
96
0
96
0
96
Certificates of deposit
0
744
0
744
0
744
U.S. government and agency
securities
42,291 5,019 0 47,310 0 47,310
Foreign government bonds
31
1,703
0
1,734
0
1,734
Mortgage-backed securities
0
1,892
0
1,892
0
1,892
Corporate notes and bonds
0
7,839
9
7,848
0
7,848
Municipal securities
0
416
0
416
0
416
Common and preferred stock
7,539
877
5
8,421
0
8,421
Derivatives
16
467
0
483
(141)
342
Total
$ 50,697
$ 19,053
$ 14
$ 69,764
$ (141)
$ 69,623
Liabilities
Derivatives and other
$ 10
$ 145
$ 0
$ 155
$ (139)
$ 16
(a) These amounts represent the impact of netting derivative assets and derivative liabilities when a legally enforceable
master netting agreement exists and fair value adjustments related to our own credit risk and counterparty credit
risk.
The changes in our Level 3 financial instruments that are measured at fair value on a recurring basis were immaterial
during the periods presented.