Microsoft 2013 Annual Report Download - page 28
Download and view the complete annual report
Please find page 28 of the 2013 Microsoft annual report below. You can navigate through the pages in the report by either clicking on the pages listed below, or by using the keyword search tool below to find specific information within the annual report.-
 1
1 -
2
-
3
-
4
-
5
-
6
-
7
-
8
-
9
-
10
-
11
-
12
-
13
-
14
-
15
-
16
-
17
-
 18
18 -
 19
19 -
 20
20 -
 21
21 -
 22
22 -
 23
23 -
 24
24 -
 25
25 -
 26
26 -
 27
27 -
 28
28 -
 29
29 -
 30
30 -
 31
31 -
 32
32 -
 33
33 -
 34
34 -
 35
35 -
 36
36 -
 37
37 -
 38
38 -
39
-
40
-
41
-
42
-
43
-
44
-
45
-
46
-
47
-
48
-
49
-
50
-
51
-
52
-
53
-
54
-
55
-
56
-
57
-
58
-
59
-
60
-
61
-
62
-
63
-
64
-
65
-
66
-
67
-
68
-
69
-
70
-
71
-
72
-
73
-
74
-
75
-
76
-
77
-
78
-
79
-
80
-
81
-
82
-
83
-
84
-
85
-
86
-
87
 |
 |

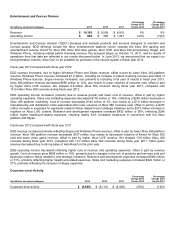
General and administrative expenses include payroll, employee benefits, stock-based compensation expense, severance
expense, and other headcount-related expenses associated with finance, legal, facilities, certain human resources and
other administrative personnel, certain taxes, and legal and other administrative fees.
Fiscal year 2013 compared with fiscal year 2012
General and administrative expenses increased due to higher legal charges from the EU fine.
Fiscal year 2012 compared with fiscal year 2011
General and administrative expenses increased, primarily due to a 10% increase in headcount-related expenses and a full
year of Puerto Rican excise taxes, offset in part by a decrease in legal charges.
Goodwill Impairment
We test goodwill for impairment annually on May 1 at the reporting unit level using a fair value approach. No impairment
of goodwill was identified as of May 1, 2013. Our goodwill impairment test as of May 1, 2012, indicated that OSD’s
carrying value exceeded its estimated fair value. Accordingly, we recorded a non-cash, non-tax deductible goodwill
impairment charge of $6.2 billion during the three months ended June 30, 2012, reducing OSD’s goodwill from $6.4 billion
to $223 million.
OTHER INCOME (EXPENSE) AND INCOME TAXES
Other Income (Expense)
The components of other income (expense) were as follows:
(In millions)
Year Ended June 30,
2013
2012
2011
Dividends and interest income
$ 677
$ 800
$ 900
Interest expense
(429)
(380)
(295)
Net recognized gains on investments
116
564
439
Net losses on derivatives
(196)
(364)
(77)
Net losses on foreign currency remeasurements
(74)
(117)
(26)
Other
194
1
(31)
Total
$ 288
$ 504
$ 910
We use derivative instruments to: manage risks related to foreign currencies, equity prices, interest rates, and credit;
enhance investment returns; and facilitate portfolio diversification. Gains and losses from changes in fair values of
derivatives that are not designated as hedges are primarily recognized in other income (expense). Other than those
derivatives entered into for investment purposes, such as commodity contracts, the gains (losses) are generally
economically offset by unrealized gains (losses) in the underlying available-for-sale securities, which are recorded as a
component of other comprehensive income (“OCI”) until the securities are sold or other-than-temporarily impaired, at
which time the amounts are reclassified from accumulated other comprehensive income (“AOCI”) into other income
(expense).
Fiscal year 2013 compared with fiscal year 2012
Dividends and interest income decreased due to lower yields on our fixed-income investments, offset in part by higher
average portfolio investment balances. Net recognized gains on investments decreased primarily due to lower gains on
sales of equity and fixed-income securities and a gain recognized on the partial sale of our Facebook holding in the prior
year, offset in part by lower other-than-temporary impairments. Other-than-temporary