Microsoft 2013 Annual Report Download - page 32
Download and view the complete annual report
Please find page 32 of the 2013 Microsoft annual report below. You can navigate through the pages in the report by either clicking on the pages listed below, or by using the keyword search tool below to find specific information within the annual report.-
 1
1 -
2
-
3
-
4
-
5
-
6
-
7
-
8
-
9
-
10
-
11
-
12
-
13
-
14
-
15
-
16
-
17
-
18
-
19
-
20
-
21
-
 22
22 -
 23
23 -
 24
24 -
 25
25 -
 26
26 -
 27
27 -
 28
28 -
 29
29 -
 30
30 -
 31
31 -
 32
32 -
 33
33 -
 34
34 -
 35
35 -
 36
36 -
 37
37 -
 38
38 -
 39
39 -
 40
40 -
 41
41 -
 42
42 -
43
-
44
-
45
-
46
-
47
-
48
-
49
-
50
-
51
-
52
-
53
-
54
-
55
-
56
-
57
-
58
-
59
-
60
-
61
-
62
-
63
-
64
-
65
-
66
-
67
-
68
-
69
-
70
-
71
-
72
-
73
-
74
-
75
-
76
-
77
-
78
-
79
-
80
-
81
-
82
-
83
-
84
-
85
-
86
-
87
 |
 |

repayments, offset in part by a $1.1 billion increase in dividends paid and a $982 million decrease in proceeds from the
issuance of common stock. Cash used in investing decreased $975 million to $23.8 billion, due mainly to an $8.5 billion
decrease in cash used for acquisitions of companies and purchases of intangible and other assets, offset in part by a $5.8
billion increase in cash used for net investment purchases, maturities, and sales and a $2.0 billion increase in cash used
for additions to property and equipment.
Fiscal year 2012 compared with fiscal year 2011
Cash flows from operations increased $4.6 billion during fiscal year 2012 to $31.6 billion, due mainly to increased revenue
and cash collections from customers. Cash used for financing increased $1.0 billion to $9.4 billion, due mainly to a $6.0
billion net decrease in proceeds from issuances of debt and a $1.2 billion increase in dividends paid, offset in part by a
$6.5 billion decrease in cash used for common stock repurchases. Cash used in investing increased $10.2 billion to $24.8
billion, due mainly to a $10.0 billion increase in acquisitions of businesses and purchases of intangible assets and a $1.4
billion decrease in cash from securities lending activities, partially offset by a $1.2 billion decrease in cash used for net
purchases, maturities, and sales of investments.
Debt
We issued debt to take advantage of favorable pricing and liquidity in the debt markets, reflecting our credit rating and the
low interest rate environment. The proceeds of these issuances were or will be used for general corporate purposes,
which may include, among other things, funding for working capital, capital expenditures, repurchases of capital stock,
acquisitions, and repayment of existing debt.
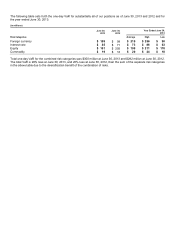
As of June 30, 2013, the total carrying value and estimated fair value of our long-term debt, including the current portion,
were $15.6 billion and $15.8 billion, respectively. This is compared to a carrying value and estimated fair value of $11.9
billion and $13.2 billion, respectively, as of June 30, 2012. These estimated fair values are based on Level 2 inputs.
The components of our long-term debt, including the current portion, and the associated interest rates were as follows as
of June 30, 2013:
Due Date
Face Value
Stated
Interest
Rate
Effective
Interest
Rate
(In millions)
Notes
September 27, 2013
$ 1,000
0.875%
1.000%
June 1, 2014
2,000
2.950%
3.049%
September 25, 2015
1,750
1.625%
1.795%
February 8, 2016
750
2.500%
2.642%
November 15, 2017
(a)
600
0.875%
1.084%
May 1, 2018 (b)
450
1.000%
1.106%
June 1, 2019
1,000
4.200%
4.379%
October 1, 2020
1,000
3.000%
3.137%
February 8, 2021
500
4.000%
4.082%
November 15, 2022 (a)
750
2.125%
2.239%
May 1, 2023
(b)
1,000
2.375%
2.465%
May 2, 2033
(c)
715
2.625%
2.690%
June 1, 2039
750
5.200%
5.240%
October 1, 2040
1,000
4.500%
4.567%
February 8, 2041
1,000
5.300%
5.361%
November 15, 2042
(a)
900
3.500%
3.571%
May 1, 2043
(b)
500
3.750%
3.829%
Total
$ 15,665
(a) In November 2012, we issued $2.25 billion of debt securities.
(b) In April 2013, we issued $1.95 billion of debt securities.
(c) In April 2013, we issued €550 million of debt securities.