Microsoft 2013 Annual Report Download - page 77
Download and view the complete annual report
Please find page 77 of the 2013 Microsoft annual report below. You can navigate through the pages in the report by either clicking on the pages listed below, or by using the keyword search tool below to find specific information within the annual report.-
 1
1 -
2
-
3
-
4
-
5
-
6
-
7
-
8
-
9
-
10
-
11
-
12
-
13
-
14
-
15
-
16
-
17
-
18
-
19
-
20
-
21
-
22
-
23
-
24
-
25
-
26
-
27
-
28
-
29
-
30
-
31
-
32
-
33
-
34
-
35
-
36
-
37
-
38
-
39
-
40
-
41
-
42
-
43
-
44
-
45
-
46
-
47
-
48
-
49
-
50
-
51
-
52
-
53
-
54
-
55
-
56
-
57
-
58
-
59
-
60
-
61
-
62
-
63
-
64
-
65
-
66
-
 67
67 -
 68
68 -
 69
69 -
 70
70 -
 71
71 -
 72
72 -
 73
73 -
 74
74 -
 75
75 -
 76
76 -
 77
77 -
 78
78 -
 79
79 -
 80
80 -
 81
81 -
 82
82 -
 83
83 -
 84
84 -
 85
85 -
 86
86 -
 87
87
 |
 |

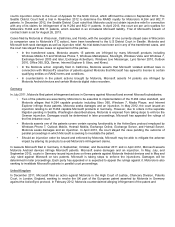
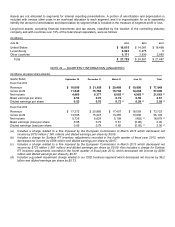
Activity for all stock plans
The fair value of each award was estimated on the date of grant using the following assumptions:
Year Ended June 30,
2013
2012
2011
Dividends per share (quarterly amounts)
$ 0.20 - $ 0.23
$ 0.16 - $ 0.20
$ 0.13 - $ 0.16
Interest rates range
0.6% - 1.1%
0.7% - 1.7%
1.1% - 2.4%
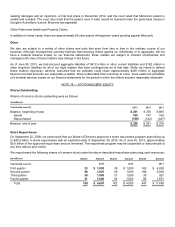
During fiscal year 2013, the following activity occurred under our stock plans:
Shares
Weighted
Average
Grant-Date
Fair Value
(In millions)
Stock Awards
Nonvested balance, beginning of year
281
$ 23.91
Granted
104
$ 28.37
Vested
(90)
$ 24.49
Forfeited
(22)
$ 25.10
Nonvested balance, end of year
273
$ 25.50
As of June 30, 2013, there was approximately $5.0 billion of total unrecognized compensation costs related to stock
awards. These costs are expected to be recognized over a weighted average period of 3 years.
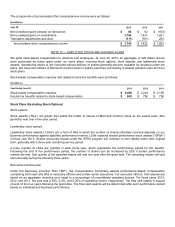
During fiscal year 2012 and 2011, the following activity occurred under our stock plans:
(In millions, except fair values)
2012
2011
Stock Awards
Awards granted
110
132
Weighted average grant-date fair value
$ 24.60
$ 22.22
Total vest-date fair value of stock awards vested was $2.8 billion, $2.4 billion, and $1.8 billion, for fiscal years 2013, 2012,
and 2011, respectively.
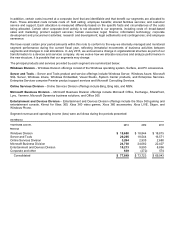
Stock Options
Currently, we grant stock options primarily in conjunction with business acquisitions. We granted two million, six million,
and zero stock options in conjunction with business acquisitions during fiscal years 2013, 2012, and 2011, respectively.
Employee stock options activity during 2013 was as follows:
Shares
Weighted
Average
Exercise Price
Weighted
Average
Remaining
Contractual
Term
Aggregate
Intrinsic
Value
(In millions)
(Years)
(In millions)
Balance, July 1, 2012
22
$ 18.69
Granted
2
$ 2.08
Exercised
(19)
$ 19.26
Canceled
(1)
$ 14.71
Balance, June 30, 2013
4
$ 6.88
6.74
$ 98
Exercisable, June 30, 2013
2
$ 8.47
5.79
$ 50