Sony 2004 Annual Report Download - page 102
Download and view the complete annual report
Please find page 102 of the 2004 Sony annual report below. You can navigate through the pages in the report by either clicking on the pages listed below, or by using the keyword search tool below to find specific information within the annual report.-
 1
1 -
2
-
3
-
4
-
5
-
6
-
7
-
8
-
9
-
10
-
11
-
12
-
13
-
14
-
15
-
16
-
17
-
18
-
19
-
20
-
21
-
22
-
23
-
24
-
25
-
26
-
27
-
28
-
29
-
30
-
31
-
32
-
33
-
34
-
35
-
36
-
37
-
38
-
39
-
40
-
41
-
42
-
43
-
44
-
45
-
46
-
47
-
48
-
49
-
50
-
51
-
52
-
53
-
54
-
55
-
56
-
57
-
58
-
59
-
60
-
61
-
62
-
63
-
64
-
65
-
66
-
67
-
68
-
69
-
70
-
71
-
72
-
73
-
74
-
75
-
76
-
77
-
78
-
79
-
80
-
81
-
82
-
83
-
84
-
85
-
86
-
87
-
88
-
89
-
90
-
91
-
 92
92 -
 93
93 -
 94
94 -
 95
95 -
 96
96 -
 97
97 -
 98
98 -
 99
99 -
 100
100 -
 101
101 -
 102
102 -
 103
103 -
 104
104 -
 105
105 -
 106
106 -
 107
107 -
 108
108 -
 109
109 -
 110
110
 |
 |

100
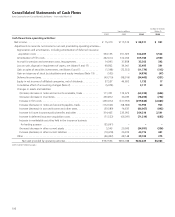
Dollars in millions
Yen in millions (Note 3)
2002 2003 2004 2004
Cash flows from operating activities:
Net income . . . . . . . . . . . . . . . . . . . . . . . . . . . . . . . . . . . . . . . . . . . . . . . . . . . ¥ 15,310 ¥115,519 ¥ 88,511 $ 851
Adjustments to reconcile net income to net cash provided by operating activities—
Depreciation and amortization, including amortization of deferred insurance
acquisition costs . . . . . . . . . . . . . . . . . . . . . . . . . . . . . . . . . . . . . . . . . . . . . 354,135 351,925 366,269 3,522
Amortization of film costs . . . . . . . . . . . . . . . . . . . . . . . . . . . . . . . . . . . . . . . 242,614 312,054 305,786 2,940
Accrual for pension and severance costs, less payments. . . . . . . . . . . . . . . . 14,995 37,858 35,562 342
Loss on sale, disposal or impairment of assets, net (Notes 9 and 17) . . . . . . 49,862 39,941 35,495 341
Gain on sales of securities investments, net (Notes 6 and 7). . . . . . . . . . . . . (1,398) (72,552) (11,774) (113)
Gain on issuances of stock by subsidiaries and equity investees (Note 19) . . (503) – (4,870) (47)
Deferred income taxes. . . . . . . . . . . . . . . . . . . . . . . . . . . . . . . . . . . . . . . . . . (49,719) (98,016) (34,445) (331)
Equity in net income of affiliated companies, net of dividends . . . . . . . . . . . 37,537 46,692 1,732 17
Cumulative effect of accounting changes (Note 2). . . . . . . . . . . . . . . . . . . . (5,978) – 2,117 20
Changes in assets and liabilities:
(Increase) decrease in notes and accounts receivable, trade . . . . . . . . . . . 111,301 174,679 (63,010) (606)
(Increase) decrease in inventories . . . . . . . . . . . . . . . . . . . . . . . . . . . . . . . 290,872 36,039 (78,656) (756)
Increase in film costs . . . . . . . . . . . . . . . . . . . . . . . . . . . . . . . . . . . . . . . . . (236,072) (317,953) (299,843) (2,883)
Increase (decrease) in notes and accounts payable, trade . . . . . . . . . . . . . (172,626) (58,384) 93,950 903
Increase (decrease) in accrued income and other taxes . . . . . . . . . . . . . . . (39,589) 14,637 (46,067) (443)
Increase in future insurance policy benefits and other . . . . . . . . . . . . . . . 314,405 233,992 264,216 2,541
Increase in deferred insurance acquisition costs . . . . . . . . . . . . . . . . . . . . (71,522) (66,091) (71,219) (685)
Increase in marketable securities held in the insurance business
for trading purpose . . . . . . . . . . . . . . . . . . . . . . . . . . . . . . . . . . . . . . . . . (55,661) – ––
(Increase) decrease in other current assets . . . . . . . . . . . . . . . . . . . . . . . . 5,543 29,095 (34,991) (336)
Increase (decrease) in other current liabilities . . . . . . . . . . . . . . . . . . . . . . (19,418) 26,205 44,772 431
Other . . . . . . . . . . . . . . . . . . . . . . . . . . . . . . . . . . . . . . . . . . . . . . . . . . . . . (46,492) 48,148 39,100 375
Net cash provided by operating activities . . . . . . . . . . . . . . . . . . . . . . . ¥737,596 ¥853,788 ¥632,635 $6,083
(Continued on following page.)
Consolidated Statements of Cash Flows
Sony Corporation and Consolidated Subsidiaries – Year ended March 31