Sony 2004 Annual Report Download - page 69
Download and view the complete annual report
Please find page 69 of the 2004 Sony annual report below. You can navigate through the pages in the report by either clicking on the pages listed below, or by using the keyword search tool below to find specific information within the annual report.-
 1
1 -
2
-
3
-
4
-
5
-
6
-
7
-
8
-
9
-
10
-
11
-
12
-
13
-
14
-
15
-
16
-
17
-
18
-
19
-
20
-
21
-
22
-
23
-
24
-
25
-
26
-
27
-
28
-
29
-
30
-
31
-
32
-
33
-
34
-
35
-
36
-
37
-
38
-
39
-
40
-
41
-
42
-
43
-
44
-
45
-
46
-
47
-
48
-
49
-
50
-
51
-
52
-
53
-
54
-
55
-
56
-
57
-
58
-
 59
59 -
 60
60 -
 61
61 -
 62
62 -
 63
63 -
 64
64 -
 65
65 -
 66
66 -
 67
67 -
 68
68 -
 69
69 -
 70
70 -
 71
71 -
 72
72 -
 73
73 -
 74
74 -
 75
75 -
 76
76 -
 77
77 -
 78
78 -
 79
79 -
80
-
81
-
82
-
83
-
84
-
85
-
86
-
87
-
88
-
89
-
90
-
91
-
92
-
93
-
94
-
95
-
96
-
97
-
98
-
99
-
100
-
101
-
102
-
103
-
104
-
105
-
106
-
107
-
108
-
109
-
110
 |
 |

67
operating income, the positive impact of the
depreciation of the yen against the euro ex-
ceeded the negative impact of the appreciation
of the yen against the U.S. dollar, resulting in a
52 percent decrease in operating income on a
local currency basis.
By region, sales decreased in Japan, the
U.S. and Europe. In Japan, hardware sales
declined due to a strategic price reduction of
PlayStation 2 hardware, despite higher unit
sales of PlayStation 2 hardware. Software sales
in Japan also decreased due to lower unit
sales. In the U.S., sales declined due to a de-
MUSIC
Sales for the fiscal year ended March 31, 2004
decreased by 37.6 billion yen, or 6.3 percent,
to 559.9 billion yen compared with the previ-
ous fiscal year. Compared to an operating loss
of 7.9 billion yen in the previous fiscal year,
operating income of 19.0 billion yen was
recorded this year.
On a local currency basis, sales in the Music
segment were flat while the Music segment
recorded operating income as compared to an
operating loss in the previous fiscal year.
Sales at Sony Music Entertainment Inc.
(“SMEI”), a U.S. based subsidiary, were flat on
a U.S. dollar basis (refer to “Foreign Exchange
Fluctuations and Risk Hedging” below). In
terms of profitability, SMEI recorded operating
income in the fiscal year as compared to an
operating loss in the previous fiscal year. The
appreciation of European currencies against
the U.S. dollar contributed to higher sales out-
side of the U.S. which were offset by lower
sales in the U.S. On a worldwide basis, total
album sales at SMEI decreased due to the con-
tinued contraction of the global music industry
and the lack of hit releases. Although unit
sales in various markets such as the U.S. have
begun to reverse their downward trend, the
global music market has continued to experi-
ence an overall contraction primarily due to
piracy (i.e. unauthorized file sharing and CD
burning) and competition from other enter-
tainment sectors.
The increase in profitability resulted in oper-
ating income at SMEI, compared to an operat-
ing loss recorded in the previous fiscal year.
The improvement in profitability primarily
resulted from the benefits realized from the
worldwide restructuring activities implemented
over the past two years to reduce costs in re-
sponse to the downward trend of the market.
These activities included the rationalization of
manufacturing, distribution and support
functions including record label shared services
through elimination of redundancy. Operating
income also benefited from lower restructuring
charges as compared to the prior year. The
total cost of restructuring for the fiscal year
ended March 31, 2004 was 95 million U.S.
dollars or 10.7 billion yen, a decrease of 95
million U.S. dollars from the prior year (refer to
“Restructuring” above for details.) A third
crease in unit sales of PlayStation 2 hardware,
a strategic price reduction of PlayStation 2
hardware and a decrease in software unit
sales. In Europe, although hardware unit sales
increased as the market penetration of
PlayStation 2 hardware continued to expand,
hardware sales declined due to a strategic
price reduction of PlayStation 2 hardware.
Software unit sales and software sales in
Europe both increased.
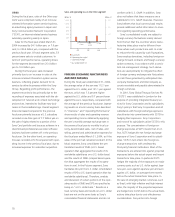
Total worldwide production shipments of
hardware and software were as follows:
tion expenses, reflecting the decrease in hard-
ware units sold. However, the ratio of selling,
general and administrative expenses to sales
rose compared to the previous fiscal year as
the ratio of personnel related costs and adver-
tising and promotion expenses to sales rose
compared with the previous fiscal year.
In terms of profitability, operating income
decreased compared with the previous fiscal
year. This decrease was due to an increase in
research and development costs for future
businesses and a decrease in hardware sales.
Research and development costs increased by
21.9 billion yen to 83.4 billion yen compared
with the previous fiscal year. Although re-
search and development costs for software
development increased only slightly, costs for
the development of semiconductors and
process technologies increased significantly.
Cost of sales in the Game segment decreased
due to the decrease in hardware unit sales and
reductions in the cost of producing hardware.
The cost of sales to sales ratio, however,
remained unchanged as the cost of producing
PlayStation 2 hardware decreased in line with
the decrease in hardware sales. Selling, general
and administrative expenses decreased as a
result of a decline in advertising and promo-
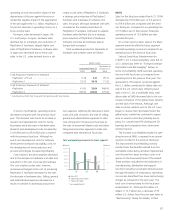
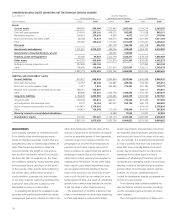
8.3%
11.8%
8.7%
–100
0
100
200
300
0
200
400
600
800
1,000
1,200
02 03 04
쐽Sales (left)
쐽Operating income (right)
쑗Operating margin
* Year ended March 31
Sales and operating income in the Game segment
(Billion ¥) (Billion ¥)
(Million units)
Cumulative as
Year ended March 31 of March 31,
2003 2004 2004
Total Production Shipments of Hardware
PlayStation + PS one . . . . . . . . . . . . . . . . . . . . . . . . . . . . . . . . . . . 6.78 3.31 99.72
PlayStation 2 . . . . . . . . . . . . . . . . . . . . . . . . . . . . . . . . . . . . . . . . . 22.52 20.10 71.30
Total Production Shipments of Software*
PlayStation . . . . . . . . . . . . . . . . . . . . . . . . . . . . . . . . . . . . . . . . . . 61.00 32.00 949.00
PlayStation 2 . . . . . . . . . . . . . . . . . . . . . . . . . . . . . . . . . . . . . . . . . 189.90 222.00 572.00
* Including those both from Sony and third parties under Sony licenses.