Sony 2004 Annual Report Download - page 81
Download and view the complete annual report
Please find page 81 of the 2004 Sony annual report below. You can navigate through the pages in the report by either clicking on the pages listed below, or by using the keyword search tool below to find specific information within the annual report.-
 1
1 -
2
-
3
-
4
-
5
-
6
-
7
-
8
-
9
-
10
-
11
-
12
-
13
-
14
-
15
-
16
-
17
-
18
-
19
-
20
-
21
-
22
-
23
-
24
-
25
-
26
-
27
-
28
-
29
-
30
-
31
-
32
-
33
-
34
-
35
-
36
-
37
-
38
-
39
-
40
-
41
-
42
-
43
-
44
-
45
-
46
-
47
-
48
-
49
-
50
-
51
-
52
-
53
-
54
-
55
-
56
-
57
-
58
-
59
-
60
-
61
-
62
-
63
-
64
-
65
-
66
-
67
-
68
-
69
-
70
-
 71
71 -
 72
72 -
 73
73 -
 74
74 -
 75
75 -
 76
76 -
 77
77 -
 78
78 -
 79
79 -
 80
80 -
 81
81 -
 82
82 -
 83
83 -
 84
84 -
 85
85 -
 86
86 -
 87
87 -
 88
88 -
 89
89 -
 90
90 -
 91
91 -
92
-
93
-
94
-
95
-
96
-
97
-
98
-
99
-
100
-
101
-
102
-
103
-
104
-
105
-
106
-
107
-
108
-
109
-
110
 |
 |
79
LIQUIDITY AND CAPITAL RESOURCES
Sony’s financial policy is to secure adequate
liquidity and financing for its operations and to
maintain the strength of its balance sheet.
Sony’s mid-term fund requirements are ex-
pected to increase due to restructuring charges
and investments in research, development and
capital expenditures for key devices, including
next generation broadband microprocessors.
These increases in expenses and investments
are part of the fundamental reform plan,
Transformation 60, which is being undertaken
across the entire Sony Group and was started
in the fiscal year beginning April 1, 2003 (refer
to “Issues Facing Sony and Management’s
Responses to those Issues” and “Forecast of
Consolidated Results” below).
In regards to the funding requirements that
arise from this business strategy, working
capital needs, repayment of existing debt, and
all its other capital needs, Sony believes that it
can maintain sufficient liquidity and financial
flexibility through operating cash flow and
cash and cash equivalents, its ability to procure
necessary funds from the financial and capital
markets, its commitment lines with banks, and
other means.
CAPITAL RESOURCES
Sony Corporation, SGTS, a Sony finance
subsidiary in the U.K., and Sony Capital
Corporation (“SCC”), a Sony finance subsidiary
in the U.S., procure funds from the financial
and capital markets.
In order to meet long-term funding require-
ments, Sony Corporation utilizes its access to
global equity and bond markets. In December
2003, Sony Corporation issued 250 billion yen
in euro yen zero coupon convertible bonds,
due in 2008. The purpose of the issuance was
to acquire funds for the growth strategy com-
ponent of Transformation 60. Sony has a shelf
registration of 200 billion yen in the Japanese
domestic bond market, of which there was no
outstanding balance as of March 31, 2004.
In order to meet the working capital require-
ments of the Group, Sony maintains commer-
cial paper (“CP”) programs and medium-term
note (“MTN”) programs through SGTS and
SCC. SGTS maintains a CP program for both
the U.S. and Euro CP markets, and a CP pro-
gram in the Japanese CP market. SCC main-
tains a CP program in the U.S. market. As of
March 31, 2004, the total amount of these CP
programs was 1,873.4 billion yen. During the
fiscal year ended March 31, 2004, the largest
month-end outstanding balance of CP at Sony
was 200.1 billion yen in November 2003.
There was no outstanding balance of CP as of
March 31, 2004.
Regarding MTNs, SGTS maintains a Euro
MTN program, while SCC maintains a Rule
144A U.S. MTN program. The total amount of
these MTN programs as of March 31, 2004
was 845.2 billion yen, and the total outstand-
ing balance was approximately 60.5 billion
yen. SCC maintains another Euro MTN pro-
gram apart from these MTN programs shown
above, but Sony does not intend to utilize this
program for future financing requirements as
Sony intends to concentrate its Euro MTN pro-
grams at SGTS.
LIQUIDITY MANAGEMENT AND
COMMITMENT LINES
Sony defines its liquidity sources as (a) cash,
cash equivalents and time deposits, and (b)
committed lines of credit contracted with
financial institutions rated “C” or above in
Bank Financial Strength ratings from Moody’s.
Sony’s basic policy is to maintain liquidity equal
to at least 100 percent of the sum of a) the
amount of average monthly sales and b) the
amount of the largest expected monthly debt
redemption during the fiscal year. Although its
working capital needs have a general tendency
to grow in the third quarter (from October to
December), Sony believes that this policy is
sufficient to meet its working capital require-
ments for any given fiscal year.
On March 31, 2004, the amount of liquidity
sources, as defined by Sony, held by consoli-
dated Sony excluding Sony Life., Sony Assur-
ance, and Sony Bank was 1,118.0 billion yen.
Of this total, cash, cash equivalents and time
deposits were 601.1 billion yen and contracts
for commitment lines with banks rated “C” or
above totaled approximately 516.9 billion yen,
of which the unused amount was approxi-
mately 515.6 billion yen. Sony also has addi-
tional commitment lines supporting its
operational needs with some financial institu-
tions, which have Moody’s financial strength
ratings of “C” or below, and these lines
amount to approximately 302.8 billion yen.
Refer to Note 11 of the Consolidated Financial
Statements for the total amount of commit-
ment lines regardless of Moody’s financial
strength rating for the fiscal year ended March
31, 2004.
In general, there are no restrictions on how
Sony’s borrowings can be used except that
some borrowings may not be used to acquire
securities listed on a U.S. exchange or traded
over-the-counter in U.S., and use of such bor-
rowing must comply with the rules and regula-
tions issued by authorities such as the Board of
Governors of the Federal Reserve Board.
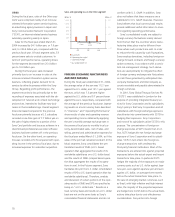
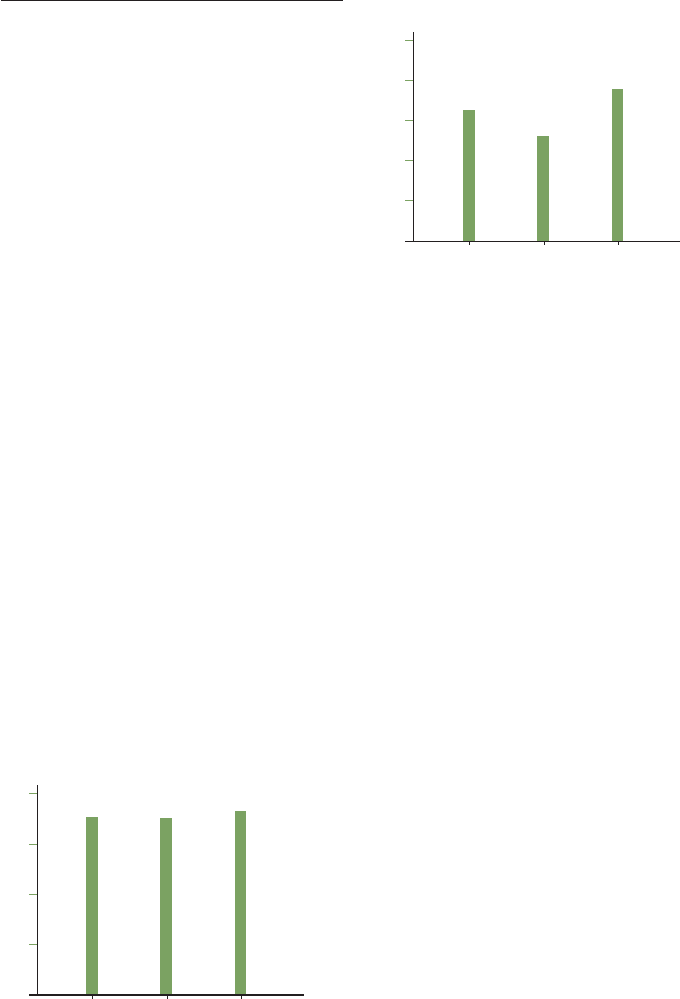
02 03 04
0
100
200
300
400
*Year ended March 31
* Including amortization expenses for intangible assets
and for deferred insurance acquisition costs
Depreciation and amortization
(Billion ¥)
0
100
200
300
400
500
02 03 04
*Year ended March 31
Capital expenditures (additions to property, plant
and equipment)
(Billion ¥)