Sony 2004 Annual Report Download - page 66
Download and view the complete annual report
Please find page 66 of the 2004 Sony annual report below. You can navigate through the pages in the report by either clicking on the pages listed below, or by using the keyword search tool below to find specific information within the annual report.-
 1
1 -
2
-
3
-
4
-
5
-
6
-
7
-
8
-
9
-
10
-
11
-
12
-
13
-
14
-
15
-
16
-
17
-
18
-
19
-
20
-
21
-
22
-
23
-
24
-
25
-
26
-
27
-
28
-
29
-
30
-
31
-
32
-
33
-
34
-
35
-
36
-
37
-
38
-
39
-
40
-
41
-
42
-
43
-
44
-
45
-
46
-
47
-
48
-
49
-
50
-
51
-
52
-
53
-
54
-
55
-
 56
56 -
 57
57 -
 58
58 -
 59
59 -
 60
60 -
 61
61 -
 62
62 -
 63
63 -
 64
64 -
 65
65 -
 66
66 -
 67
67 -
 68
68 -
 69
69 -
 70
70 -
 71
71 -
 72
72 -
 73
73 -
 74
74 -
 75
75 -
 76
76 -
77
-
78
-
79
-
80
-
81
-
82
-
83
-
84
-
85
-
86
-
87
-
88
-
89
-
90
-
91
-
92
-
93
-
94
-
95
-
96
-
97
-
98
-
99
-
100
-
101
-
102
-
103
-
104
-
105
-
106
-
107
-
108
-
109
-
110
 |
 |

64
by the simple average of stockholders’ equity
at the end of the previous fiscal year and at
the end of the fiscal year ended March 31,
2004.)
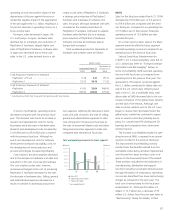
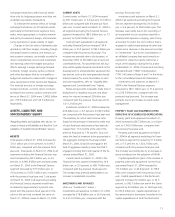
Basic net income per share was 95.97 yen
compared with 125.74 yen in the previous fiscal
year, and diluted net income per share was
90.88 yen compared with 118.21 yen in the
previous fiscal year. Refer to Notes 2 and 21 of
Notes to Consolidated Financial Statements.
ELECTRONICS
Sales for the fiscal year ended March 31, 2004
decreased by 43.1 billion yen, or 0.9 percent,
to 4,897.4 billion yen compared with the
previous fiscal year. An operating loss of 35.3
billion yen was recorded compared to operat-
ing income of 41.4 billion yen in the previous
fiscal year.
At the beginning of the fiscal year ended
March 31, 2004, Sony partly realigned its busi-
ness segment configuration. Expenses incurred
in connection with the creation of a network
platform business have been transferred out of
the Other segment and reclassified as unallo-
cated corporate expenses, because the ex-
pected future benefits of this business will be
spread across the Sony Group. In the Music
segment, certain non-core businesses of Sony
Music Entertainment (Japan) Inc., such as
media, animation, character and cosmetics,
were transferred to the newly-established Sony
Culture Entertainment, Inc. (“SCU”) and SCU
was classified in the Other segment. In accor-
dance with this realignment, results of the
previous fiscal year have been reclassified to
conform to the presentation for the fiscal year
ended March 31, 2004.
0
50
100
150
0
5
10
15
0.7%
5.0%
3.8%
02 03 04
쐽Net income
쑗ROE
*Year ended March 31
Net income and ROE
(Billion ¥) (%)
02 03 04
0
50
100
150
쐽Basic
쐽Diluted
*Year ended March 31
Net income per share of common stock
(¥)
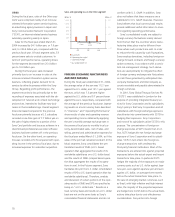
*Year ended March 31, 2004
*Including intersegment transactions
쐽Electronics
쐽Game
쐽Music
쐽Pictures
쐽Financial Services
쐽Other
Share of sales and operating revenue by
business segment
(%)
62
10
7
10
74
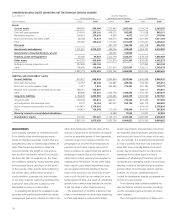
OPERATING PERFORMANCE BY BUSINESS SEGMENT
The following discussion is based on segment information. Sales and operating revenue in each
business segment include intersegment transactions. Refer to Note 24 of Notes to Consolidated
Financial Statements.
Business Segment Information
(Yen in billions)
Year ended March 31 Percent
Sales and operating revenue 2003 2004 change
Electronics . . . . . . . . . . . . . . . . . . . . . . . . . . . . . . . . . . . . . . . . . 4,940.5 4,897.4 –0.9%
Game . . . . . . . . . . . . . . . . . . . . . . . . . . . . . . . . . . . . . . . . . . . . . 955.0 780.2 –18.3
Music . . . . . . . . . . . . . . . . . . . . . . . . . . . . . . . . . . . . . . . . . . . . . 597.5 559.9 –6.3
Pictures . . . . . . . . . . . . . . . . . . . . . . . . . . . . . . . . . . . . . . . . . . . 802.8 756.4 –5.8
Financial Services . . . . . . . . . . . . . . . . . . . . . . . . . . . . . . . . . . . . 537.3 593.5 +10.5
Other . . . . . . . . . . . . . . . . . . . . . . . . . . . . . . . . . . . . . . . . . . . . . 306.3 330.4 +7.9
Elimination . . . . . . . . . . . . . . . . . . . . . . . . . . . . . . . . . . . . . . . . . (665.7) (421.4) –
Consolidated . . . . . . . . . . . . . . . . . . . . . . . . . . . . . . . . . . . . . . . 7,473.6 7,496.4 +0.3
(Yen in billions)
Year ended March 31 Percent
Operating income (loss) 2003 2004 change
Electronics . . . . . . . . . . . . . . . . . . . . . . . . . . . . . . . . . . . . . . . . . 41.4 (35.3) –
Game . . . . . . . . . . . . . . . . . . . . . . . . . . . . . . . . . . . . . . . . . . . . . 112.7 67.6 –40.0%
Music . . . . . . . . . . . . . . . . . . . . . . . . . . . . . . . . . . . . . . . . . . . . . (7.9) 19.0 –
Pictures . . . . . . . . . . . . . . . . . . . . . . . . . . . . . . . . . . . . . . . . . . . 59.0 35.2 –40.3
Financial Services . . . . . . . . . . . . . . . . . . . . . . . . . . . . . . . . . . . . 22.8 55.2 +142.4
Other . . . . . . . . . . . . . . . . . . . . . . . . . . . . . . . . . . . . . . . . . . . . . (25.0) (10.0) –
Elimination and unallocated corporate expenses . . . . . . . . . . . . . (17.5) (32.7) –
Consolidated . . . . . . . . . . . . . . . . . . . . . . . . . . . . . . . . . . . . . . . 185.4 98.9 –46.7