Sony 2004 Annual Report Download - page 74
Download and view the complete annual report
Please find page 74 of the 2004 Sony annual report below. You can navigate through the pages in the report by either clicking on the pages listed below, or by using the keyword search tool below to find specific information within the annual report.-
 1
1 -
2
-
3
-
4
-
5
-
6
-
7
-
8
-
9
-
10
-
11
-
12
-
13
-
14
-
15
-
16
-
17
-
18
-
19
-
20
-
21
-
22
-
23
-
24
-
25
-
26
-
27
-
28
-
29
-
30
-
31
-
32
-
33
-
34
-
35
-
36
-
37
-
38
-
39
-
40
-
41
-
42
-
43
-
44
-
45
-
46
-
47
-
48
-
49
-
50
-
51
-
52
-
53
-
54
-
55
-
56
-
57
-
58
-
59
-
60
-
61
-
62
-
63
-
 64
64 -
 65
65 -
 66
66 -
 67
67 -
 68
68 -
 69
69 -
 70
70 -
 71
71 -
 72
72 -
 73
73 -
 74
74 -
 75
75 -
 76
76 -
 77
77 -
 78
78 -
 79
79 -
 80
80 -
 81
81 -
 82
82 -
 83
83 -
 84
84 -
85
-
86
-
87
-
88
-
89
-
90
-
91
-
92
-
93
-
94
-
95
-
96
-
97
-
98
-
99
-
100
-
101
-
102
-
103
-
104
-
105
-
106
-
107
-
108
-
109
-
110
 |
 |
72
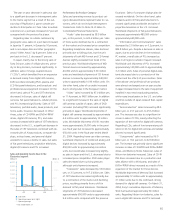
and Game segments) amounted to 175.0
billion yen, of which investments in production
equipment for next generation broadband
microprocessors amounted to 69.0 billion yen.
Capital expenditures in the Music segment
decreased by 7.3 billion yen, or 36.2 percent,
to 12.9 billion yen, in the Pictures segment by
1.1 billion yen, or 15.8 percent to 6.0 billion
yen, and in the Other segment by 6.9 billion
yen, or 40.4 percent, to 10.1 billion yen.
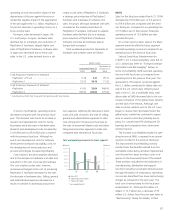
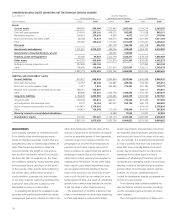
Property, plant and equipment on March
31, 2004 in the Financial Services segment
decreased 5.2 billion yen, or 11.2 percent, to
40.8 billion yen compared with the previous
fiscal year-end. Capital expenditures in the
Financial Services segment increased 1.0 billion
yen, or 26.3 percent, to 4.6 billion yen.
OTHER ASSETS
Other assets on March 31, 2004 decreased by
63.5 billion yen, or 3.8 percent, to 1,592.6
billion yen, compared with the previous fiscal
year-end.
Other assets on March 31, 2004 in all seg-
ments excluding the Financial Services segment
increased by 0.1 billion yen to 1,251.9 billion
yen. Other assets on March 31, 2004 in the
Financial Services segment increased 25.2
billion yen, or 5.8 percent, to 460.0 billion yen
compared with the previous year. This was
mainly due to an increase in deferred insurance
acquisition costs at Sony Life.
Deferred tax assets on March 31, 2004 de-
creased by 124.9 billion yen, or 38.1 percent,
to 203.2 billion yen compared with the previ-
ous fiscal year-end. The decrease was due to
the offset between deferred tax assets and
liabilities recorded at each of the companies
within the Sony Group, as a result of the adop-
tion of consolidated tax filing in Japan.
LIABILITIES
Total current and long-term liabilities on March
31, 2004 increased by 622.2 billion yen, or
10.3 percent, to 6,689.8 billion yen compared
with the previous fiscal year-end. Total current
and long-term liabilities on March 31, 2004 in
all segments excluding the Financial Services
segment increased by 189.6 billion yen, or 5.2
percent, to 3,855.9 billion yen. Total current
and long-term liabilities on March 31, 2004, in
the Financial Services segment increased by
515.4 billion yen, or 19.9 percent, to 3,099.8
billion yen, compared with the previous fiscal
year-end. Total liabilities on March 31, 2004 in
all segments excluding the Financial Services
segment would have increased by approxi-
mately 10 percent compared with the previous
fiscal year-end if the value of the yen had re-
mained the same on March 31, 2004 as it was
on March 31 of the previous fiscal year.
CURRENT LIABILITIES
Current liabilities on March 31, 2004 increased
by 547.2 billion yen, or 22.5 percent, to
2,982.2 billion yen compared with the previ-
ous fiscal year-end. Current liabilities on March
31, 2004 in all segments excluding the Finan-
cial Services segment increased by 307.7 billion
yen, or 14.9 percent, to 2,373.6 billion yen.
Short-term borrowings and current portion
of long-term debt on March 31, 2004 in all
segments excluding the Financial Services
segment increased 283.1 billion yen, or 223.4
percent, to 409.8 billion yen compared with
the previous fiscal year-end. This increase was
mainly due to the shift from long-term liabili-
ties to current liabilities of 287.8 billion yen (as
of March 31, 2004) in outstanding convertible
bonds, due for redemption on March 31,
2005, and an increase of 57.3 billion yen in
bank syndicated loans, which will reach matu-
rity by November 2004, as a result of the
adoption of FIN 46. Partially offsetting these
items was a 52.8 billion yen repayment of
commercial paper during the fiscal year.
Notes and accounts payable, trade on
March 31, 2004 in all segments excluding the
Financial Services segment increased by 79.6
billion yen, or 11.5 percent, to 773.2 billion
yen compared with the previous fiscal year-
end. This increase was particularly conspicuous
in the Electronics segment, where inventories
also increased.
Current liabilities on March 31, 2004 in the
Financial Services segment increased by 232.9
billion yen, or 56.0 percent, to 648.8 billion
yen, mainly due to the increase in deposits
from customers and interbank short-term
borrowings in the banking business. Deposits
from customers in the banking business in-
creased by 130.1 billion yen, or 52.3 percent,
to 378.9 billion yen, due to the expansion of
the banking business.
LONG-TERM LIABILITIES
Long-term liabilities on March 31, 2004 in-
creased by 75.0 billion yen, or 2.1 percent, to
3,707.6 billion yen compared with the previ-
ous fiscal year-end.
Long-term liabilities on March 31, 2004 in all
segments excluding the Financial Services seg-
ment decreased by 118.1 billion yen, or 7.4 per-
cent, to 1,482.4 billion yen. This decrease was
mainly due to a 129.2 billion yen, or 26.5 per-
cent, decrease to 358.2 billion yen of accrued
pension and severance costs primarily resulting
from an increase in pension assets due to the
rise in value of equity investment in Japan.
Long-term debt on March 31, 2004 in all
segments excluding the Financial Services seg-
ment decreased 27.7 billion yen, or 3.4 per-
cent, to 775.2 billion yen. This was mainly due
to the shift to current liabilities of 287.8 billion
yen (as of March 31, 2004) in outstanding
convertible bonds, due for redemption on
March 31, 2005, and despite the issuance of
the 250.0 billion yen in euro yen convertible
bonds (bonds with stock acquisition rights).
Long-term liabilities on March 31, 2004 in
the Financial Services segment increased by
282.5 billion yen, or 13.0 percent, to 2,451.0
billion yen. This was due to an increase in in-
surance-in-force in the life insurance business
which resulted in an increase in future insur-
ance policy benefits and other of 264.2 billion
yen, or 13.8 percent, to 2,178.6 billion yen.
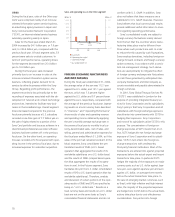
TOTAL INTEREST-BEARING DEBT
Total interest-bearing debt on March 31, 2004
increased by 286.5 billion yen, or 29.7 percent,
to 1,252.7 billion yen, compared with the pre-
vious fiscal year-end. Total interest-bearing
debt on March 31, 2004 in all segments ex-
cluding the Financial Services segment in-
creased by 255.4 billion yen, or 27.5 percent,
to 1,185.0 billion yen.