Sony 2004 Annual Report Download - page 72
Download and view the complete annual report
Please find page 72 of the 2004 Sony annual report below. You can navigate through the pages in the report by either clicking on the pages listed below, or by using the keyword search tool below to find specific information within the annual report.-
 1
1 -
2
-
3
-
4
-
5
-
6
-
7
-
8
-
9
-
10
-
11
-
12
-
13
-
14
-
15
-
16
-
17
-
18
-
19
-
20
-
21
-
22
-
23
-
24
-
25
-
26
-
27
-
28
-
29
-
30
-
31
-
32
-
33
-
34
-
35
-
36
-
37
-
38
-
39
-
40
-
41
-
42
-
43
-
44
-
45
-
46
-
47
-
48
-
49
-
50
-
51
-
52
-
53
-
54
-
55
-
56
-
57
-
58
-
59
-
60
-
61
-
 62
62 -
 63
63 -
 64
64 -
 65
65 -
 66
66 -
 67
67 -
 68
68 -
 69
69 -
 70
70 -
 71
71 -
 72
72 -
 73
73 -
 74
74 -
 75
75 -
 76
76 -
 77
77 -
 78
78 -
 79
79 -
 80
80 -
 81
81 -
 82
82 -
83
-
84
-
85
-
86
-
87
-
88
-
89
-
90
-
91
-
92
-
93
-
94
-
95
-
96
-
97
-
98
-
99
-
100
-
101
-
102
-
103
-
104
-
105
-
106
-
107
-
108
-
109
-
110
 |
 |

70
OTHER
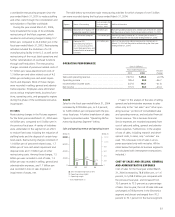
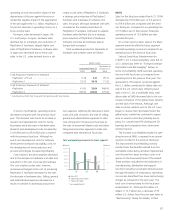
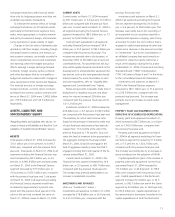
During the fiscal year, sales of the Other seg-
ment were comprised mainly of an in-house
oriented information system service business,
an advertising agency business in Japan and
Sony Communication Network Corporation
(“SCN”), an Internet-related service business
subsidiary operating mainly in Japan.
Sales for the fiscal year ended March 31,
2004 increased by 24.1 billion yen, or 7.9 per-
cent, to 330.4 billion yen, compared with the
previous fiscal year. Of total segment sales, 53
percent were sales to outside customers. In
terms of profit performance, operating losses
for the segment decreased from 25.0 billion
yen to 10.0 billion yen.
During the fiscal year, sales increased
primarily due to an increase in sales at the
in-house oriented information system service
business, reflecting greater demand for its
services by other businesses within the Sony
Group. Regarding profit performance, the
segment recorded a loss primarily due to the
recording of expenses associated with the de-
velopment of network and content technology
and services, intended to facilitate new busi-
nesses in the broadband age. Overall segment
losses decreased compared to the previous
fiscal year primarily because a U.S. subsidiary
recorded a one-time gain of 7.7 billion yen on
the sale of rights related to a portion of the
Sony Card portfolio and because software in a
discontinued professional-use video software
business had been written off in the previous
fiscal year. On the other hand, an operating
loss was recorded at SCN compared with oper-
ating income in the previous fiscal year, due to
increased expenses for subscriber acquisition.
FOREIGN EXCHANGE FLUCTUATIONS
AND RISK HEDGING
During the fiscal year ended March 31, 2004,
the average value of the yen was 112.1 yen
against the U.S. dollar, and 131.1 yen against
the euro, which was 7.3 percent higher
against the U.S. dollar and 9.7 percent lower
against the euro, respectively, compared with
the average of the previous fiscal year. Operat-
ing results on a local currency basis described
in “Overview” and “Operating Performance”
show results of sales and operating revenue
and operating income obtained by applying
the yen’s monthly average exchange rate in
the previous fiscal year to monthly local cur-
rency-denominated sales, cost of sales, and
selling, general and administrative expenses for
the fiscal year ended March 31, 2004, as if the
value of the yen had remained constant. In the
Music segment, Sony consolidates the yen-
translated results of SMEI (a U.S. based
operation that aggregates the results of its
worldwide subsidiaries on a U.S. dollar basis)
and the results of SMEJ (a Japan based opera-
tion that aggregates the results of its opera-
tions in yen). In the Pictures segment, Sony
translates into yen the U.S. dollar consolidated
results of SPE (a U.S. based operation that has
worldwide subsidiaries). Therefore, analysis
and discussion of certain portions of the oper-
ating results of SMEI and SPE are specified as
being on “a U.S. dollar basis.” Results on a
local currency basis and results on a U.S. dollar
basis are not on the same basis as Sony’s
consolidated financial statements and do not
conform with U.S. GAAP. In addition, Sony
does not believe that these measures are a
substitute for U.S. GAAP measures. However,
Sony believes that local currency basis results
provide additional useful information to inves-
tors regarding operating performance.
Sony’s consolidated results are subject to
foreign currency fluctuations mainly derived
from the fact that the countries where manu-
facturing takes place may be different from
those where such products are sold. In order
to reduce the risk caused by such fluctuations,
Sony employs derivatives, including foreign ex-
change forward contracts and foreign currency
option contracts, in accordance with a consis-
tent risk management strategy. Such deriva-
tives are used primarily to mitigate the effect
of foreign currency exchange rate fluctuations
on cash flows generated by anticipated inter-
company transactions and intercompany ac-
counts receivable and payable denominated in
foreign currencies.
In 2001, Sony Global Treasury Services Plc
(“SGTS”) was established in London for the
purpose of providing integrated treasury ser-
vices for Sony Corporation and its subsidiaries.
Sony’s policy is that Sony Corporation and all
subsidiaries with foreign exchange exposures
should enter into commitments with SGTS for
hedging their exposures. Sony Corporation
and most of its subsidiaries utilize SGTS for this
purpose. The concentration of foreign ex-
change exposures at SGTS means that, in ef-
fect, SGTS hedges the net foreign exchange
exposure of Sony Corporation and its subsid-
iaries. SGTS in turn enters into foreign ex-
change transactions with creditworthy
third-party financial institutions. Most of the
transactions are entered into against projected
exposures before the actual export and import
transactions take place. In particular SGTS
hedges the majority of the exposures on major
currency pairs such as U.S. dollar against Japa-
nese yen, euro against Japanese yen and euro
against U.S. dollar, on average three months
before the actual transactions take place. In
the case of emerging market currencies, such
as Brazil, with high inflation and high interest
rates, the majority of the projected exposures
are hedged one month before the actual trans-
actions take place due to cost effectiveness
considerations. Sony enters into foreign
–7.0% –8.2%
–3.0%
02 03 04
–100
0
100
200
300
0
200
400
600
800
1,000
1,200
쐽Sales (left)
쐽Operating loss (right)
쑗Operating margin
* Year ended March 31
Sales and operating loss in the Other segment
(Billion ¥) (Billion ¥)