Sony 2004 Annual Report Download - page 103
Download and view the complete annual report
Please find page 103 of the 2004 Sony annual report below. You can navigate through the pages in the report by either clicking on the pages listed below, or by using the keyword search tool below to find specific information within the annual report.-
 1
1 -
2
-
3
-
4
-
5
-
6
-
7
-
8
-
9
-
10
-
11
-
12
-
13
-
14
-
15
-
16
-
17
-
18
-
19
-
20
-
21
-
22
-
23
-
24
-
25
-
26
-
27
-
28
-
29
-
30
-
31
-
32
-
33
-
34
-
35
-
36
-
37
-
38
-
39
-
40
-
41
-
42
-
43
-
44
-
45
-
46
-
47
-
48
-
49
-
50
-
51
-
52
-
53
-
54
-
55
-
56
-
57
-
58
-
59
-
60
-
61
-
62
-
63
-
64
-
65
-
66
-
67
-
68
-
69
-
70
-
71
-
72
-
73
-
74
-
75
-
76
-
77
-
78
-
79
-
80
-
81
-
82
-
83
-
84
-
85
-
86
-
87
-
88
-
89
-
90
-
91
-
92
-
 93
93 -
 94
94 -
 95
95 -
 96
96 -
 97
97 -
 98
98 -
 99
99 -
 100
100 -
 101
101 -
 102
102 -
 103
103 -
 104
104 -
 105
105 -
 106
106 -
 107
107 -
 108
108 -
 109
109 -
 110
110
 |
 |

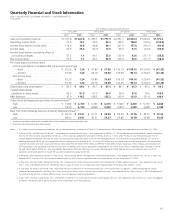
101
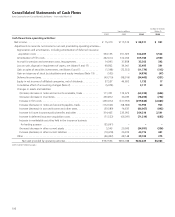
Dollars in millions
Yen in millions (Note 3)
2002 2003 2004 2004
Cash flows from investing activities:
Payments for purchases of fixed assets . . . . . . . . . . . . . . . . . . . . . . . . . . . . . ¥(388,514) ¥ (275,285) ¥ (427,344) $ (4,109)
Proceeds from sales of fixed assets . . . . . . . . . . . . . . . . . . . . . . . . . . . . . . . . 37,434 25,711 33,987 327
Payments for investments and advances by financial service business . . . . . . (689,944) (1,012,508) (1,167,945) (11,231)
Payments for investments and advances (other than financial service business) . . (106,396) (123,839) (33,329) (320)
Proceeds from sales of securities investments, maturities of marketable securities
and collections of advances by financial service business . . . . . . . . . . . . . . . 330,239 529,395 791,188 7,607
Proceeds from sales of securities investments, maturities of marketable securities
and collections of advances (other than financial service business) . . . . . . . . 48,842 148,977 35,521 342
(Increase) decrease in time deposits. . . . . . . . . . . . . . . . . . . . . . . . . . . . . . . . 1,222 1,124 (1,456) (14)
Cash assumed upon acquisition by stock exchange offering . . . . . . . . . . . . . – – 3,634 35
Proceeds from the issuance of stock by subsidiaries (Note 19) . . . . . . . . . . . . – – 3,952 38
Net cash used in investing activities . . . . . . . . . . . . . . . . . . . . . . . . . . (767,117) (706,425) (761,792) (7,325)
Cash flows from financing activities:
Proceeds from issuance of long-term debt . . . . . . . . . . . . . . . . . . . . . . . . . . 228,999 12,323 267,864 2,575
Payments of long-term debt . . . . . . . . . . . . . . . . . . . . . . . . . . . . . . . . . . . . . (171,739) (238,144) (32,042) (308)
Decrease in short-term borrowings . . . . . . . . . . . . . . . . . . . . . . . . . . . . . . . . (78,104) (7,970) (57,708) (555)
Increase in deposits from customers in the banking business (Note 12) . . . . . 106,472 142,023 129,874 1,249
Proceeds from issuance of subsidiary tracking stock (Note 15) . . . . . . . . . . . . 9,529 – ––
Dividends paid . . . . . . . . . . . . . . . . . . . . . . . . . . . . . . . . . . . . . . . . . . . . . . . (22,951) (22,871) (23,106) (222)
Other . . . . . . . . . . . . . . . . . . . . . . . . . . . . . . . . . . . . . . . . . . . . . . . . . . . . . . 12,834 21,505 28,401 273
Net cash provided by (used in) financing activities . . . . . . . . . . . . . . . 85,040 (93,134) 313,283 3,012
Effect of exchange rate changes on cash and cash equivalents . . . . . . . . . . . 21,036 (24,971) (47,973) (461)
Net increase in cash and cash equivalents . . . . . . . . . . . . . . . . . . . . . . . . . . . 76,555 29,258 136,153 1,309
Cash and cash equivalents at beginning of the fiscal year . . . . . . . . . . . . . . . 607,245 683,800 713,058 6,856
Cash and cash equivalents at end of the fiscal year . . . . . . . . . . . . . . . . . . . . ¥ 683,800 ¥ 713,058 ¥ 849,211 $ 8,165
Supplemental data:
Cash paid during the year for—
Income taxes. . . . . . . . . . . . . . . . . . . . . . . . . . . . . . . . . . . . . . . . . . . . . . . . . ¥ 148,154 ¥ 171,531 ¥ 114,781 $ 1,104
Interest . . . . . . . . . . . . . . . . . . . . . . . . . . . . . . . . . . . . . . . . . . . . . . . . . . . . . 35,371 22,216 22,571 217
Non-cash investing and financing activities—
Obtaining assets by entering into capital lease . . . . . . . . . . . . . . . . . . . . . . . ¥ 10,572 ¥ 9,034 ¥ 18,298 $ 176
Contribution of assets into an affiliated company . . . . . . . . . . . . . . . . . . . . . 10,545 – ––
The accompanying notes are an integral part of these statements.
* U.S. dollar amounts have been translated from yen, for convenience only, at the rate of ¥104=U.S.$1, the approximate Tokyo foreign exchange market rate as of March 31, 2004.