Sony 2004 Annual Report Download - page 107
Download and view the complete annual report
Please find page 107 of the 2004 Sony annual report below. You can navigate through the pages in the report by either clicking on the pages listed below, or by using the keyword search tool below to find specific information within the annual report.-
 1
1 -
2
-
3
-
4
-
5
-
6
-
7
-
8
-
9
-
10
-
11
-
12
-
13
-
14
-
15
-
16
-
17
-
18
-
19
-
20
-
21
-
22
-
23
-
24
-
25
-
26
-
27
-
28
-
29
-
30
-
31
-
32
-
33
-
34
-
35
-
36
-
37
-
38
-
39
-
40
-
41
-
42
-
43
-
44
-
45
-
46
-
47
-
48
-
49
-
50
-
51
-
52
-
53
-
54
-
55
-
56
-
57
-
58
-
59
-
60
-
61
-
62
-
63
-
64
-
65
-
66
-
67
-
68
-
69
-
70
-
71
-
72
-
73
-
74
-
75
-
76
-
77
-
78
-
79
-
80
-
81
-
82
-
83
-
84
-
85
-
86
-
87
-
88
-
89
-
90
-
91
-
92
-
93
-
94
-
95
-
96
-
 97
97 -
 98
98 -
 99
99 -
 100
100 -
 101
101 -
 102
102 -
 103
103 -
 104
104 -
 105
105 -
 106
106 -
 107
107 -
 108
108 -
 109
109 -
 110
110
 |
 |

105
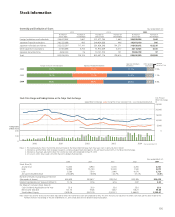
Stock Information
(Year ended March 31)
2000 2001 2002 2003 2004
Stock Price (¥)
At year-end 14,500 8,900 6,700 4,200 4,360
High 16,950 15,100 10,340 7,530 4,670
Low 5,360 7,510 3,960 4,070 2,720
Annual Increase/Decrease +164.8% –38.6% –24.7% –37.3% +3.8%
Number of Shares Outstanding at Year-end
(thousands of shares) 453,639 919,617 919,744 922,385 926,418
Market Capitalization at Year-end (trillion ¥) 13.16 8.16 6.16 3.87 4.04
Per Share of Common Stock Data (¥)
Cash Dividends Applicable to the Year 25.0 25.0 25.0 25.0 25.0
Net Income (Diluted) 131.70 19.28 16.67 118.21 90.88
Stockholders’ Equity 2,409.36 2,521.19 2,570.31 2,466.81 2,563.67
Note: Stock Prices and Per Share Data have been adjusted to reflect the two-for-one stock split completed on May 19, 2000. However, no adjustment to reflect such stock split has been made to the
Number of Shares Outstanding at the year ended March 31, 2000. Stock price data are based on daily closing prices.
Stock Price Range and Trading Volume on the Tokyo Stock Exchange
Notes: 1. This trading volume shows the monthly volume of trade on the Tokyo Stock Exchange. Each fiscal year starts in April and ends in March.
2. Stock prices and the Nikkei Stock Average is based on a simple average of daily closing prices for each day of every month at the Tokyo Stock Exchange.
3. Stock prices have been adjusted to reflect the two-for-one stock split completed on May 19, 2000.
4. On June 20, 2001, Sony issued 3,072,000 shares of Subsidiary Tracking Stock.
Trading Volume
(million shares)
Stock Price and
Nikkei Stock Average
(¥)
(Year ended March 31)
2002
2003
2004
38.7%
35.8%
39.4%
28.2%
27.0%
20.7%
27.4%
30.5%
34.0%
5.2%
5.6%
4.8%
0.5%
1.1%
1.1%
Japanese
Securities Firms
Other Japanese
Corporations
Japanese Individuals
and OthersJapanese Financial InstitutionsForeign Institutions and Individuals
Ownership and Distribution of Shares (Year ended March 31)
2002 2003 2004
Number of Number of Number of Number of Number of Number of
Shares Held Shareholders Shares Held Shareholders Shares Held Shareholders
Foreign Institutions and Individuals 356,673,842 1,667 331,477,756 1,660 366,289,954 1,444
Japanese Financial Institutions 260,533,688 485 249,934,658 446 192,651,120 386
Japanese Individuals and Others 253,033,597 717,141 281,939,398 791,371 316,428,972 823,335
Other Japanese Corporations 47,924,895 5,755 51,973,659 6,017 44,113,525 5,726
Japanese Securities Firms 4,650,333 76 10,131,705 121 10,006,709 97
Total 922,816,355 725,124 925,457,176 799,615 929,490,280 830,988
0
5,000
10,000
15,000
20,000
25,000
0
100
200
2000 2001 2002 2003 2004
Nikkei Stock Average Closing Price of Sony Corporation Stock Subsidiary Tracking Stock