Sony 2004 Annual Report Download - page 64
Download and view the complete annual report
Please find page 64 of the 2004 Sony annual report below. You can navigate through the pages in the report by either clicking on the pages listed below, or by using the keyword search tool below to find specific information within the annual report.-
 1
1 -
2
-
3
-
4
-
5
-
6
-
7
-
8
-
9
-
10
-
11
-
12
-
13
-
14
-
15
-
16
-
17
-
18
-
19
-
20
-
21
-
22
-
23
-
24
-
25
-
26
-
27
-
28
-
29
-
30
-
31
-
32
-
33
-
34
-
35
-
36
-
37
-
38
-
39
-
40
-
41
-
42
-
43
-
44
-
45
-
46
-
47
-
48
-
49
-
50
-
51
-
52
-
53
-
 54
54 -
 55
55 -
 56
56 -
 57
57 -
 58
58 -
 59
59 -
 60
60 -
 61
61 -
 62
62 -
 63
63 -
 64
64 -
 65
65 -
 66
66 -
 67
67 -
 68
68 -
 69
69 -
 70
70 -
 71
71 -
 72
72 -
 73
73 -
 74
74 -
75
-
76
-
77
-
78
-
79
-
80
-
81
-
82
-
83
-
84
-
85
-
86
-
87
-
88
-
89
-
90
-
91
-
92
-
93
-
94
-
95
-
96
-
97
-
98
-
99
-
100
-
101
-
102
-
103
-
104
-
105
-
106
-
107
-
108
-
109
-
110
 |
 |

62
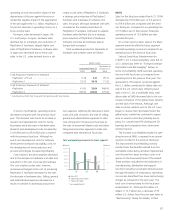
The cost of sales ratio decreased from 61.5
percent to 60.7 percent in the Music segment.
However, the cost of sales ratio increased from
58.2 percent to 60.0 percent in the Pictures
segment.
In the Electronics segment, the benefit of
restructuring undertaken in previous years was
offset primarily by an increase in research and
development costs during the fiscal year. In
the Game segment, the effect of increased
PlayStation 2 software sales was offset by in-
creased research and development costs. The
cost of sales ratio in the Music segment de-
creased due to the benefits from restructuring
activities implemented over the past several
fiscal years. However, the cost of sales ratio in
the Pictures segment increased due to the ab-
sence of the higher margins generated by rev-
enues from Spider-Man in the prior fiscal year.
Personnel related costs included in cost of
sales increased only 1.7 billion yen compared
with the previous fiscal year.
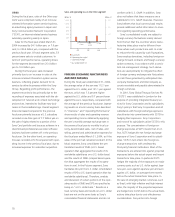
Research and development costs (included
in cost of sales) for the fiscal year ended March
31, 2004 increased by 71.4 billion yen, or 16.1
percent, to 514.5 billion yen compared with
the previous fiscal year, primarily due to increases
in the Electronics and Game segments. The ratio
of research and development costs to sales in-
creased from 6.4 percent to 7.5 percent.
Selling, general and administrative expenses
for the fiscal year ended March 31, 2004 in-
creased by 15.9 billion yen, or 0.9 percent, to
1,798.2 billion yen compared with the previous
fiscal year. The ratio of selling, general and
administrative expenses to sales increased from
25.6 percent in the previous fiscal year to 25.9
percent. Year on year, the ratio of selling,
general and administrative expenses to sales
increased from 20.3 percent to 21.8 percent in
the Electronics segment, from 18.0 percent to
21.1 percent in the Game segment, and from
34.4 percent to 35.0 percent in the Pictures
segment, while it decreased from 39.8 percent
to 35.0 percent in the Music segment.
Of the selling, general and administrative
expenses, personnel related costs in selling,
general and administrative expenses increased
by 89.7 billion yen compared with the previous
fiscal year mainly due to an increase in sever-
ance related expenses in the Electronics segment
resulting from the implementation of restructuring
initiatives. However, the increase in selling,
general and administrative expenses was par-
tially offset by a decrease in royalty expenses,
which decreased by 20.5 billion yen compared
with the previous fiscal year due to the rever-
sal, in the fiscal year ended March 31, 2004, of
royalty expense reserves provided for in the
previous fiscal year in the Electronics segment.
Loss on sale, disposal or impairment of
assets, net decreased 4.4 billion yen, or 11.1
percent, compared with the previous fiscal
year, to 35.5 billion yen. Losses were recorded
on the sale, disposal and impairment of CRT
production equipment in the Electronics seg-
ment, on the impairment of goodwill that re-
sulted from the making of a manufacturing
subsidiary into a wholly owned subsidiary in
the Electronics segment, and on the com-
mencement of reorganization proceedings
under the Corporate Reorganization Law of
Japan by Crosswave Communications Inc.
(“Crosswave”), which leased fixed assets from
a business in the Financial Services segment.
On the other hand, a one time gain was re-
corded in the Other segment due to the sale of
rights to a portion of the Sony Card portfolio.
OPERATING INCOME
Operating income for the fiscal year ended
March 31, 2004 decreased by 86.5 billion yen,
or 46.7 percent, to 98.9 billion yen compared
with the previous fiscal year. Operating income
margin decreased from 2.5 percent to 1.3
percent. The Electronics segment recorded an
operating loss mainly due to an increase in
restructuring charges. On the other hand, the
business segments that contributed the most
to operating income, in descending order by
amount of financial impact, were the Game
and Financial Services segments.
OTHER INCOME AND EXPENSES
In the consolidated results for the fiscal year
ended March 31, 2004, other income de-
creased by 35.2 billion yen, or 22.4 percent, to
122.3 billion yen, while other expenses de-
creased by 18.2 billion yen, or 19.1 percent, to
77.1 billion yen, compared with the previous
fiscal year. The net amount of other income
and other expenses was net other income of
45.2 billion yen, a decrease of 17.0 billion yen,
or 27.4 percent, compared with the previous
fiscal year.
The decrease in other income was primarily
due to the recording, in the fiscal year ended
March 31, 2003, of a 66.5 billion yen gain on
the sale of Sony’s equity interest in Telemundo
Communications Group, Inc. and its subsidiaries
(“Telemundo”), a U.S. based Spanish language
television network and station group that was
accounted for under the equity method.
Partially offsetting the decrease in other
02 03 04
70
71
72
73
74
75
22
23
24
25
26
27
23.9
73.5
72.0
74.2 25.9
25.6
쑗 Cost of sales/sales (left)
쑗 SGA/sales (right)
*Year ended March 31
*Excluding the Financial Services segment
Cost of sales and selling, general and administrative
expenses (SGA) as percentages of sales
(%) (%)
0
100
200
300
400
500
600
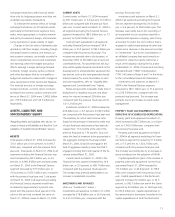
6.1% 6.4%
7.5%
02 03 04 0
2
4
6
8
10
쐽Research and development expenses
쑗Percentage of sales
*Year ended March 31
*Excluding the Financial Services segment
Research and development expenses and as a
percentage of sales
(Billion ¥) (%)