Sony 2004 Annual Report Download - page 63
Download and view the complete annual report
Please find page 63 of the 2004 Sony annual report below. You can navigate through the pages in the report by either clicking on the pages listed below, or by using the keyword search tool below to find specific information within the annual report.-
 1
1 -
2
-
3
-
4
-
5
-
6
-
7
-
8
-
9
-
10
-
11
-
12
-
13
-
14
-
15
-
16
-
17
-
18
-
19
-
20
-
21
-
22
-
23
-
24
-
25
-
26
-
27
-
28
-
29
-
30
-
31
-
32
-
33
-
34
-
35
-
36
-
37
-
38
-
39
-
40
-
41
-
42
-
43
-
44
-
45
-
46
-
47
-
48
-
49
-
50
-
51
-
52
-
 53
53 -
 54
54 -
 55
55 -
 56
56 -
 57
57 -
 58
58 -
 59
59 -
 60
60 -
 61
61 -
 62
62 -
 63
63 -
 64
64 -
 65
65 -
 66
66 -
 67
67 -
 68
68 -
 69
69 -
 70
70 -
 71
71 -
 72
72 -
 73
73 -
74
-
75
-
76
-
77
-
78
-
79
-
80
-
81
-
82
-
83
-
84
-
85
-
86
-
87
-
88
-
89
-
90
-
91
-
92
-
93
-
94
-
95
-
96
-
97
-
98
-
99
-
100
-
101
-
102
-
103
-
104
-
105
-
106
-
107
-
108
-
109
-
110
 |
 |

61
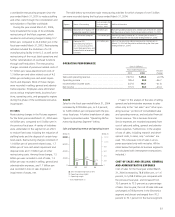
SALES
Sales for the fiscal year ended March 31, 2004
increased by 22.8 billion yen, or 0.3 percent,
to 7,496.4 billion yen compared with the pre-
vious fiscal year. A further breakdown of sales
figures is presented under “Operating Perfor-
mance by Business Segment” below.
(“Sales” in this analysis of the ratio of selling,
general and administrative expenses to sales
refers only to the “net sales” and “other oper-
ating revenue” portions of consolidated sales
and operating revenue, and excludes Financial
Service revenue. This is because Financial
Service expenses are recorded separately from
cost of sales and selling, general and adminis-
trative expenses. Furthermore, in the analysis
of cost of sales, including research and devel-
opment costs, to sales, only “net sales” are
used. This is because cost of sales is an ex-
pense associated only with net sales. All the
ratios below that pertain to business segments
are calculated with intersegment transactions
included.)
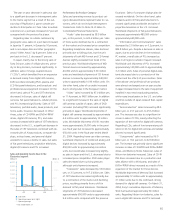
COST OF SALES AND SELLING, GENERAL
AND ADMINISTRATIVE EXPENSES
Cost of sales for the fiscal year ended March
31, 2004 increased by 78.8 billion yen, or 1.6
percent, to 5,058.2 billion yen compared with
the previous fiscal year, and increased from
72.0 percent to 73.5 percent as a percentage
of sales. Year on year, the cost of sales ratio was
unchanged at 78.8 percent in the Electronics
segment and almost unchanged from 70.2
percent to 70.1 percent in the Game segment.
a worldwide restructuring program since the
year ended March 31, 2001 to reduce staffing
and other costs through the consolidation and
rationalization of facilities worldwide.
During the year ended March 31, 2004,
Sony broadened the scope of its worldwide
restructuring of the Music segment, which
resulted in restructuring charges totaling 10.7
billion yen, compared to 22.4 billion yen in the
fiscal year ended March 31, 2003. Restructuring
activities included the shutdown of a CD
manufacturing facility in the U.S. as well as the
restructuring of the music label operations and
further rationalization of overhead functions
through staff reductions. The restructuring
charges consisted of personnel related costs of
5.1 billion yen, lease abandonment costs of
1.3 billion yen and other related costs of 4.2
billion yen including non-cash asset impair-
ments and disposals. Most of these charges
were recorded in selling, general and adminis-
trative expense. Employees were eliminated
across various employee levels, business func-
tions, operating units, and geographic regions
during this phase of the worldwide restructur-
ing program.
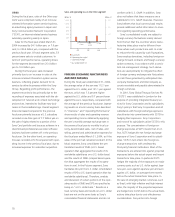
PICTURES
Restructuring charges in the Pictures segment
for the fiscal year ended March 31, 2004 were
4.6 billion yen, compared to 0.5 billion yen in
the previous fiscal year. A variety of initiatives
were undertaken in the segment in an effort
to reduce fixed costs including the reduction of
staffing levels and the disposal of certain long-
lived assets. Restructuring charges consisted of
1.0 billion yen of personnel related costs, 1.7
billion yen of non-cash asset impairment and
disposal costs and 1.9 billion yen of other
restructuring costs. Among these charges, 1.5
billion yen was recorded in cost of sales, 1.3
billion yen was recorded in selling, general and
administrative expenses, and 1.7 billion yen
was recorded in loss on sale, disposal or
impairment of assets, net.
0
2,000
4,000
6,000
8,0008,0008,000
0
2,000
4,000
6,000
8,0008,000
1.8%
2.5%
1.3%
02 03 04
0
200
400
600
800
1,000
1,200
0
200
400
600
800
1,000
1,200
Sales and operating revenue and operating income
(Billion ¥) (Billion ¥)
쐽Sales and operating revenue (left)
쐽Operating income (right)
쑗Operating margin
*Year ended March 31
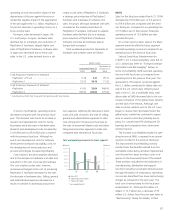
Segment
Electronics
Music
Nature of Restructuring
Reduction of TV display CRT
production capacity in Japan
Early retirement program
Closure of CD
manufacturing facility in
U.S., restructuring of the
music label operations, and
rationalization of overhead
functions
Costs incurred in the
fiscal year ended
March 31, 2004
8.5 billion yen
114.0 billion yen
10.7 billion yen
Additional Information
Remaining liability balance of 2.2 billion yen at March 31, 2004
will be paid or settled in the fiscal year ending March 31, 2005.
Remaining liability balance of 18.3 billion yen at March 31,
2004 will be paid in the fiscal year ending March 31, 2005.
Most of the remaining liability balance of 6.2 billion yen at
March 31, 2004 will be paid or settled during the fiscal year
ending March 31, 2005.
The table below summarizes major restructuring activities for which charges of over 5 billion
yen were recorded during the fiscal year ended March 31, 2004.
OPERATING PERFORMANCE
(Yen in billions)
Year ended March 31 Percent
2003 2004 change
Sales and operating revenue . . . . . . . . . . . . . . . . . . . . . . . . . . . 7,473.6 7,496.4 +0.3%
Operating income . . . . . . . . . . . . . . . . . . . . . . . . . . . . . . . . . . 185.4 98.9 –46.7
Income before income taxes . . . . . . . . . . . . . . . . . . . . . . . . . . . 247.6 144.1 –41.8
Net income . . . . . . . . . . . . . . . . . . . . . . . . . . . . . . . . . . . . . . . 115.5 88.5 –23.4