Sony 2004 Annual Report Download - page 76
Download and view the complete annual report
Please find page 76 of the 2004 Sony annual report below. You can navigate through the pages in the report by either clicking on the pages listed below, or by using the keyword search tool below to find specific information within the annual report.-
 1
1 -
2
-
3
-
4
-
5
-
6
-
7
-
8
-
9
-
10
-
11
-
12
-
13
-
14
-
15
-
16
-
17
-
18
-
19
-
20
-
21
-
22
-
23
-
24
-
25
-
26
-
27
-
28
-
29
-
30
-
31
-
32
-
33
-
34
-
35
-
36
-
37
-
38
-
39
-
40
-
41
-
42
-
43
-
44
-
45
-
46
-
47
-
48
-
49
-
50
-
51
-
52
-
53
-
54
-
55
-
56
-
57
-
58
-
59
-
60
-
61
-
62
-
63
-
64
-
65
-
 66
66 -
 67
67 -
 68
68 -
 69
69 -
 70
70 -
 71
71 -
 72
72 -
 73
73 -
 74
74 -
 75
75 -
 76
76 -
 77
77 -
 78
78 -
 79
79 -
 80
80 -
 81
81 -
 82
82 -
 83
83 -
 84
84 -
 85
85 -
 86
86 -
87
-
88
-
89
-
90
-
91
-
92
-
93
-
94
-
95
-
96
-
97
-
98
-
99
-
100
-
101
-
102
-
103
-
104
-
105
-
106
-
107
-
108
-
109
-
110
 |
 |

74
INVESTMENTS
Sony regularly evaluates its investment portfo-
lio to identify other-than-temporary impair-
ments of individual securities. Factors that are
considered by Sony in determining whether an
other-than-temporary decline in value has
occurred include: the length of time and ex-
tent to which the market value of the security
has been less than its original cost, the finan-
cial condition, operating results, business plans
and estimated future cash flows of the issuer
of the security, other specific factors affecting
the market value, deterioration of issuer’s
credit condition, sovereign risk, and whether
or not Sony is able to retain the investment for
a period of time sufficient to allow for the
anticipated recovery in market value.
In evaluating the factors for available-for-sale
securities with readily determinable fair values,
management presumes a decline in value to be
other-than-temporary if the fair value of the
security is 20 percent or more below its original
cost for an extended period of time (generally
a period of up to six to twelve months). The
presumption of an other-than-temporary im-
pairment in such cases may be overcome if
there is evidence to support that the decline is
temporary in nature due to the existence of
other factors which overcome the duration or
magnitude of the decline. On the other hand,
there may be cases where impairment losses
are recognized when the decline in the fair
value of the security is not more than 20 per-
cent or such decline has not existed for an ex-
tended period of time, as a result of considering
specific factors which may indicate the decline
in the fair value is other-than-temporary.
The assessment of whether a decline in the
value of an investment is other-than-temporary
is often judgmental in nature and involves
certain assumptions and estimates concerning
the expected operating results, business plans
and future cash flows of the issuer of the secu-
rity. Accordingly, it is possible that investments
in Sony’s portfolio that have had a decline in
value that Sony currently believes to be tem-
porary may be determined to be other-than-
temporary in the future based on Sony’s
evaluation of additional information such as
continued poor operating results, future broad
declines in value of worldwide equity markets
and the effect of world wide interest rate fluc-
tuations. As a result, unrealized losses re-
corded for investments may be recognized into
income in future periods.
The following table contains available for
sale and held to maturity securities, breaking
out the unrealized gains and losses by invest-
ment category.
The most significant portion of these unre-
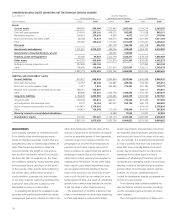
CONDENSED BALANCE SHEETS SEPARATING OUT THE FINANCIAL SERVICES SEGMENT
As at March 31 All other Segments
Financial Services excluding Financial Services Consolidated
(Yen in millions) 2003 2004 2003 2004 2003 2004
Assets
Current assets . . . . . . . . . . . . . . . . . . . . . . . . . . . . . . . . . 684,945 699,698 2,503,940 2,692,436 3,154,214 3,363,355
Cash and cash equivalents . . . . . . . . . . . . . . . . . . . . . . . . . 274,543 256,316 438,515 592,895 713,058 849,211
Marketable securities . . . . . . . . . . . . . . . . . . . . . . . . . . . . . 236,621 270,676 4,899 4,072 241,520 274,748
Notes and accounts receivable, trade . . . . . . . . . . . . . . . . . 68,188 72,273 943,073 943,590 1,007,395 1,011,189
Other . . . . . . . . . . . . . . . . . . . . . . . . . . . . . . . . . . . . . . . . . 105,593 100,433 1,117,453 1,151,879 1,192,241 1,228,207
Film costs . . . . . . . . . . . . . . . . . . . . . . . . . . . . . . . . . . . . . – –287,778 256,740 287,778 256,740
Investments and advances . . . . . . . . . . . . . . . . . . . . . . . 1,731,415 2,274,510 383,004 358,629 1,994,123 2,512,950
Investments in Financial Services, at cost . . . . . . . . . . . – –166,905 176,905 ––
Property, plant and equipment . . . . . . . . . . . . . . . . . . . 45,990 40,833 1,232,359 1,324,211 1,278,350 1,365,044
Other assets . . . . . . . . . . . . . . . . . . . . . . . . . . . . . . . . . . . 434,769 459,998 1,251,810 1,251,901 1,656,080 1,592,573
Deferred insurance acquisition costs . . . . . . . . . . . . . . . . . . 327,869 349,194 ––327,869 349,194
Other . . . . . . . . . . . . . . . . . . . . . . . . . . . . . . . . . . . . . . . . . 106,900 110,804 1,251,810 1,251,901 1,328,211 1,243,379
2,897,119 3,475,039 5,825,796 6,060,822 8,370,545 9,090,662
Liabilities and stockholders’ equity
Current liabilities . . . . . . . . . . . . . . . . . . . . . . . . . . . . . . . 415,877 648,803 2,065,854 2,373,550 2,435,048 2,982,215
Short-term borrowings . . . . . . . . . . . . . . . . . . . . . . . . . . . . 72,753 86,748 126,687 409,766 158,745 475,017
Notes and accounts payable, trade . . . . . . . . . . . . . . . . . . . 5,417 7,847 693,589 773,221 697,385 778,773
Deposits from customers in the banking business . . . . . . . . 248,721 378,851 ––248,721 378,851
Other . . . . . . . . . . . . . . . . . . . . . . . . . . . . . . . . . . . . . . . . . 88,986 175,357 1,245,578 1,190,563 1,330,197 1,349,574
Long-term liabilities . . . . . . . . . . . . . . . . . . . . . . . . . . . . . 2,168,476 2,450,969 1,600,484 1,482,378 3,632,580 3,707,587
Long-term debt . . . . . . . . . . . . . . . . . . . . . . . . . . . . . . . . . 140,908 135,811 802,911 775,233 807,439 777,649
Accrued pension and severance costs . . . . . . . . . . . . . . . . . 8,737 10,183 487,437 358,199 496,174 368,382
Future insurance policy benefits and other . . . . . . . . . . . . . 1,914,410 2,178,626 ––1,914,410 2,178,626
Other . . . . . . . . . . . . . . . . . . . . . . . . . . . . . . . . . . . . . . . . . 104,421 126,349 310,136 348,946 414,557 382,930
Minority interest in consolidated subsidiaries . . . . . . . – –16,288 17,554 22,022 22,858
Stockholders’ equity . . . . . . . . . . . . . . . . . . . . . . . . . . . . 312,766 375,267 2,143,170 2,187,340 2,280,895 2,378,002
2,897,119 3,475,039 5,825,796 6,060,822 8,370,545 9,090,662