Sony 2007 Annual Report Download - page 110
Download and view the complete annual report
Please find page 110 of the 2007 Sony annual report below. You can navigate through the pages in the report by either clicking on the pages listed below, or by using the keyword search tool below to find specific information within the annual report.-
 1
1 -
2
-
3
-
4
-
5
-
6
-
7
-
8
-
9
-
10
-
11
-
12
-
13
-
14
-
15
-
16
-
17
-
18
-
19
-
20
-
21
-
22
-
23
-
24
-
25
-
26
-
27
-
28
-
29
-
30
-
31
-
32
-
33
-
34
-
35
-
36
-
37
-
38
-
39
-
40
-
41
-
42
-
43
-
44
-
45
-
46
-
47
-
48
-
49
-
50
-
51
-
52
-
53
-
54
-
55
-
56
-
57
-
58
-
59
-
60
-
61
-
62
-
63
-
64
-
65
-
66
-
67
-
68
-
69
-
70
-
71
-
72
-
73
-
74
-
75
-
76
-
77
-
78
-
79
-
80
-
81
-
82
-
83
-
84
-
85
-
86
-
87
-
88
-
89
-
90
-
91
-
92
-
93
-
94
-
95
-
96
-
97
-
98
-
99
-
 100
100 -
 101
101 -
 102
102 -
 103
103 -
 104
104 -
 105
105 -
 106
106 -
 107
107 -
 108
108 -
 109
109 -
 110
110 -
 111
111 -
 112
112 -
 113
113 -
 114
114 -
 115
115 -
 116
116 -
 117
117
 |
 |

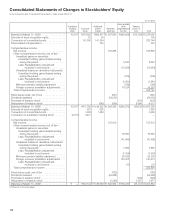
107
Yen in millions
2005 2006 2007
Cash flows from investing activities:
Payments for purchases of fixed assets . . . . . . . . . . . . . . . . . . . . . . . . . . . . . . . .
¥ (453,445) ¥ (462,473) ¥ (527,515)
Proceeds from sales of fixed assets . . . . . . . . . . . . . . . . . . . . . . . . . . . . . . . . . . .
34,184 38,168 87,319
Payments for investments and advances by financial service business . . . . . . . . .
(1,309,092) (1,368,158) (914,754)
Payments for investments and advances (other than financial service business) . . .
(158,151) (36,947) (100,152)
Proceeds from maturities of marketable securities, sales of securities
investments and collections of advances by financial service business . . . . . . . . . .
923,593 857,376 679,772
Proceeds from maturities of marketable securities, sales of securities
investments and collections of advances (other than financial service business) . . .
25,849 24,527 22,828
Proceeds from sales of subsidiaries’ and equity investees’ stocks . . . . . . . . . . . .
3,162 75,897 43,157
Other . . . . . . . . . . . . . . . . . . . . . . . . . . . . . . . . . . . . . . . . . . . . . . . . . . . . . . . . . .
2,728 346 (6,085)
Net cash used in investing activities . . . . . . . . . . . . . . . . . . . . . . . . . . . .
(931,172) (871,264) (715,430)
Cash flows from financing activities:
Proceeds from issuance of long-term debt . . . . . . . . . . . . . . . . . . . . . . . . . . . . . .
57,232 246,326 270,780
Payments of long-term debt . . . . . . . . . . . . . . . . . . . . . . . . . . . . . . . . . . . . . . . . .
(94,862) (138,773) (182,374)
Increase (decrease) in short-term borrowings . . . . . . . . . . . . . . . . . . . . . . . . . . . .
11,397 (11,045) 6,096
Increase in deposits from customers in the financial service business . . . . . . . . . . .
294,352 190,320 273,435
Increase (decrease) in call money and bills sold in the banking business . . . . . . . . . .
(40,400) 86,100 (100,700)
Dividends paid . . . . . . . . . . . . . . . . . . . . . . . . . . . . . . . . . . . . . . . . . . . . . . . . . . .
(22,978) (24,810) (25,052)
Proceeds from issuance of shares under stock-based compensation plans . . . . .
105 4,681 5,566
Proceeds from issuance of shares by subsidiaries . . . . . . . . . . . . . . . . . . . . . . . .
4,023 6,937 2,217
Other . . . . . . . . . . . . . . . . . . . . . . . . . . . . . . . . . . . . . . . . . . . . . . . . . . . . . . . . . .
(3,692) 128 (2,065)
Net cash provided by financing activities . . . . . . . . . . . . . . . . . . . . . . . . .
205,177 359,864 247,903
Effect of exchange rate changes on cash and cash equivalents . . . . . . . . . . . . . . . .
8,890 35,537 3,300
Net increase (decrease) in cash and cash equivalents . . . . . . . . . . . . . . . . . . . . . . .
(70,108) (76,005) 96,801
Cash and cash equivalents at beginning of the fiscal year . . . . . . . . . . . . . . . . . . . .
849,211 779,103 703,098
Cash and cash equivalents at end of the fiscal year . . . . . . . . . . . . . . . . . . . . . . . . .
¥ 779,103 ¥ 703,098 ¥ 799,899
Supplemental data:
Cash paid during the fiscal year for—
Income taxes . . . . . . . . . . . . . . . . . . . . . . . . . . . . . . . . . . . . . . . . . . . . . . . . . . . .
¥ 65,477 ¥ 70,019 ¥ 104,822
Interest . . . . . . . . . . . . . . . . . . . . . . . . . . . . . . . . . . . . . . . . . . . . . . . . . . . . . . . .
18,187 24,651 23,000
Non-cash investing and financing activities—
Conversion of convertible bonds . . . . . . . . . . . . . . . . . . . . . . . . . . . . . . . . . . . . .
¥ 282,744 ¥ — ¥ —
Obtaining assets by entering into capital lease . . . . . . . . . . . . . . . . . . . . . . . . . . .
19,049 19,682 13,784
Contribution of net assets into the joint venture with Bertelsmann AG . . . . . . . . . .
9,402 — —