Sony 2007 Annual Report Download - page 64
Download and view the complete annual report
Please find page 64 of the 2007 Sony annual report below. You can navigate through the pages in the report by either clicking on the pages listed below, or by using the keyword search tool below to find specific information within the annual report.-
 1
1 -
2
-
3
-
4
-
5
-
6
-
7
-
8
-
9
-
10
-
11
-
12
-
13
-
14
-
15
-
16
-
17
-
18
-
19
-
20
-
21
-
22
-
23
-
24
-
25
-
26
-
27
-
28
-
29
-
30
-
31
-
32
-
33
-
34
-
35
-
36
-
37
-
38
-
39
-
40
-
41
-
42
-
43
-
44
-
45
-
46
-
47
-
48
-
49
-
50
-
51
-
52
-
53
-
 54
54 -
 55
55 -
 56
56 -
 57
57 -
 58
58 -
 59
59 -
 60
60 -
 61
61 -
 62
62 -
 63
63 -
 64
64 -
 65
65 -
 66
66 -
 67
67 -
 68
68 -
 69
69 -
 70
70 -
 71
71 -
 72
72 -
 73
73 -
 74
74 -
75
-
76
-
77
-
78
-
79
-
80
-
81
-
82
-
83
-
84
-
85
-
86
-
87
-
88
-
89
-
90
-
91
-
92
-
93
-
94
-
95
-
96
-
97
-
98
-
99
-
100
-
101
-
102
-
103
-
104
-
105
-
106
-
107
-
108
-
109
-
110
-
111
-
112
-
113
-
114
-
115
-
116
-
117
 |
 |

61
recorded restructuring charges of 9.7 billion yen for the fiscal
year ended March 31, 2007, and these charges were included in
selling, general and administrative expenses in the consolidated
statements of income. The remaining liability balance as of
March 31, 2007 was 7.2 billion yen and will be paid through the
fiscal year ending March 31, 2008.
For more detailed information about restructuring, please refer
to Note 17 of Notes to the Consolidated Financial Statements.
OPERATING PERFORMANCE
Yen in billions Percent change
Years ended March 31 2006 2007 2007/2006
Sales and operating revenue . .
7,510.6 8,295.7 +10.5%
Operating income . . . . . . . . . .
226.4 71.8 –68.3
Income before income taxes . .
286.3 102.0 –64.4
Equity in net income of
affiliated companies . . . . . . . .
13.2 78.7 +496.9
Net income . . . . . . . . . . . . . . .
123.6 126.3 +2.2
SALES
Sales for the fiscal year ended March 31, 2007 increased by
785.1 billion yen, or 10.5 percent, to 8,295.7 billion yen compared
with the previous fiscal year. A further breakdown of sales figures
is presented under “Operating Performance by Business
Segment” below.
“Sales” in this analysis of the ratio of cost of sales, including
research and development costs, and selling, general and
administrative expenses to sales refers only to the “net sales”
and “other operating revenue” portions of consolidated sales
and operating revenue, and excludes financial service revenue.
This is because financial service expenses are recorded sepa-
rately from cost of sales and selling, general and administrative
expenses. The calculations of all ratios below that pertain to
business segments include intersegment transactions.
COST OF SALES AND SELLING, GENERAL AND
ADMINISTRATIVE EXPENSES
Cost of sales for the fiscal year ended March 31, 2007 increased
by 738.2 billion yen, or 14.3 percent, to 5,889.6 billion yen
compared with the previous fiscal year, and increased from 75.9
percent to 76.8 percent as a percentage of sales. Year on year,
the cost of sales ratio decreased from 80.6 percent to 78.8
percent in the Electronics segment, increased from 80.4 percent
to 102.8 percent in the Game segment, and increased from
60.2 percent to 60.3 percent in the Pictures segment.
In the Electronics segment, there was an improvement in the
cost of sales ratio for several products, in particular digital cameras,
LCD televisions and video cameras. In the Game segment, there
was a deterioration in the cost of sales ratio. This deterioration
was primarily the result of the loss arising from the sale of the
PS3 at strategic price points lower than its production cost
during the introductory period, as well as the recording of other
charges in association with preparation for the launch of the
PS3 platform. In the Pictures segment, operating income
increased due to substantially higher revenue. However, the cost
of sales ratio was flat compared to the previous fiscal year due
to the recording of production expenses associated with several
new network television shows in the television business in the
current fiscal year and the absence of a licensing agreement
extension for Wheel of Fortune, which was recognized in the
previous fiscal year.
The personnel-related costs included in cost of sales were
457.3 billion yen, an increase of 1.0 billion yen, primarily recorded
within the Electronics segment.
Research and development costs (all research and develop-
ment costs are included within cost of sales) for the fiscal year
ended March 31, 2007 increased by 12.1 billion yen to 543.9
billion yen compared with the previous fiscal year. The ratio of
research and development costs to sales was 7.1 percent
compared to 7.8 percent in the previous fiscal year.
Selling, general and administrative expenses for the fiscal year
ended March 31, 2007 increased by 261.4 billion yen, or 17.1
percent, to 1,788.4 billion yen compared with the previous fiscal
year. The ratio of selling, general and administrative expenses to
sales increased from 22.5 percent in the previous fiscal year to
23.3 percent. Year on year, the ratio of selling, general and
administrative expenses to sales increased from 18.0 percent to
18.2 percent in the Electronics segment and from 18.7 percent to
20.0 percent in the Game segment. On the other hand, the ratio
of selling, general and administrative expenses to sales decreased
from 36.0 percent to 35.2 percent in the Pictures segment.
Personnel-related costs in selling, general and administrative
expenses increased by 54.4 billion yen compared with the
previous fiscal year mainly due to the recording of a gain
resulting from the transfer to the Japanese government of
the substitutional portion of Sony’s employee pension fund in
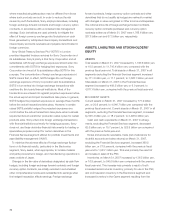
Sales and operating revenue
and operating income
■ Sales and operating revenue (left)
■ Operating income (right)
● Operating margin
*Years ended March 31
(Yen in trillions) (Yen in billions)
10.0
7.5
5.0
2.5
0
1,000
750
500
250
0
2005 2006 2007
2.0%
3.0%
0.9%