Sony 2007 Annual Report Download - page 75
Download and view the complete annual report
Please find page 75 of the 2007 Sony annual report below. You can navigate through the pages in the report by either clicking on the pages listed below, or by using the keyword search tool below to find specific information within the annual report.-
 1
1 -
2
-
3
-
4
-
5
-
6
-
7
-
8
-
9
-
10
-
11
-
12
-
13
-
14
-
15
-
16
-
17
-
18
-
19
-
20
-
21
-
22
-
23
-
24
-
25
-
26
-
27
-
28
-
29
-
30
-
31
-
32
-
33
-
34
-
35
-
36
-
37
-
38
-
39
-
40
-
41
-
42
-
43
-
44
-
45
-
46
-
47
-
48
-
49
-
50
-
51
-
52
-
53
-
54
-
55
-
56
-
57
-
58
-
59
-
60
-
61
-
62
-
63
-
64
-
 65
65 -
 66
66 -
 67
67 -
 68
68 -
 69
69 -
 70
70 -
 71
71 -
 72
72 -
 73
73 -
 74
74 -
 75
75 -
 76
76 -
 77
77 -
 78
78 -
 79
79 -
 80
80 -
 81
81 -
 82
82 -
 83
83 -
 84
84 -
 85
85 -
86
-
87
-
88
-
89
-
90
-
91
-
92
-
93
-
94
-
95
-
96
-
97
-
98
-
99
-
100
-
101
-
102
-
103
-
104
-
105
-
106
-
107
-
108
-
109
-
110
-
111
-
112
-
113
-
114
-
115
-
116
-
117
 |
 |

72
■CURRENT LIABILITIES
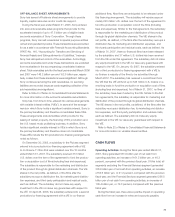
Current liabilities on March 31, 2007 increased by 351.6 billion
yen, or 11.0 percent, to 3,551.9 billion yen compared with the
previous fiscal year-end. Current liabilities on March 31, 2007 in
all segments excluding the Financial Services segment increased
by 311.3 billion yen, or 13.4 percent, to 2,640.6 billion yen.
Short-term borrowings and the current portion of long-term
debt on March 31, 2007 in all segments, excluding the Financial
Services segment, decreased 144.1 billion yen, or 64.0 percent,
to 80.9 billion yen compared with the previous fiscal year-end.
This was principally as a result of a decrease in the current
portion of long-term debt, due to the redemption of straight
bonds and medium-term notes.
Notes and accounts payable, trade on March 31, 2007 in all
segments, excluding the Financial Services segment, increased
by 362.9 billion yen, or 45.1 percent, to 1,167.3 billion yen
compared with the previous fiscal year-end.
Current liabilities on March 31, 2007 in the Financial Services
segment increased by 39.1 billion yen, or 4.3 percent, to 957.5
billion yen, mainly due to an increase in deposits from customers
at Sony Bank.
■LONG-TERM LIABILITIES
Long-term liabilities on March 31, 2007 increased by 588.3
billion yen, or 14.1 percent, to 4,754.8 billion yen compared with
the previous fiscal year-end.
Long-term liabilities on March 31, 2007 in all segments,
excluding the Financial Services segment, increased by 277.7
billion yen, or 22.7 percent, to 1,500.3 billion yen. In addition,
long-term debt on March 31, 2007 in all segments, excluding
the Financial Services segment, increased by 223.9 billion yen,
or 31.9 percent, to 925.3 billion yen. Long-term debt increased
primarily due to the execution of yen-denominated syndicated
loans for the purpose of allocating funds for general corporate
purposes, including capital expenditures, and for debt redemption.
Long-term liabilities on March 31, 2007 in the Financial
Services segment increased by 324.0 billion yen, or 10.6
percent, to 3,380.2 billion yen. This was due to an increase in
insurance-in-force in the life insurance business which resulted
in an increase in future insurance policy benefits and other of
293.3 billion yen, or 10.7 percent, to 3,037.7 billion yen.
■TOTAL INTEREST-BEARING DEBT
Total interest-bearing debt on March 31, 2007 decreased by
4.8 billion yen, or 0.4 percent, to 1,096.5 billion yen, compared
with the previous fiscal year-end. Total interest-bearing debt on
March 31, 2007 in all segments, excluding the Financial Services
segment, increased by 79.7 billion yen, or 8.6 percent, to
1,006.2 billion yen.
STOCKHOLDERS’ EQUITY
Stockholders’ equity on March 31, 2007 increased by 166.9
billion yen, or 5.2 percent, to 3,370.7 billion yen compared with
the previous fiscal year-end. Retained earnings increased
116.9 billion yen compared with the previous fiscal year-end,
and accumulated other comprehensive income (net of tax) was
115.5 billion yen. This was primarily due to accumulated other
comprehensive income of 86.3 billion yen arising from foreign
currency translation adjustments in the current fiscal year due
to the depreciation of the yen, partially offset by a decrease in
unrealized gains on securities in accumulated other comprehen-
sive income of 14.7 billion yen in the current fiscal year. The ratio
of stockholders’ equity to total assets decreased 1.4 percentage
points compared to the end of the previous fiscal year, from
30.2 percent to 28.8 percent.
(Yen in billions)
Interest-bearing liabilities
■Short-term (including the current
portion of long-term debt)
■Long-term
*As of March 31
1,600
1,200
800
400
02005 2006 2007
(Yen)
Stockholders’ equity per share
of common stock
*As of March 31
4,000
3,000
2,000
1,000
02005 2006 2007
(Yen in billions)
Stockholders’ equity and
stockholders’ equity ratio
■ Stockholders’ equity
● Stockholders’ equity ratio
Stockholders’ equity ratio =
Stockholders’ equity/Total assets
*As of March 31
(%)
40
30
20
10
0
4,000
3,000
2,000
1,000
02005 2006 2007
30.2% 30.2% 28.8%