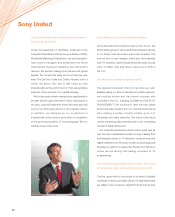
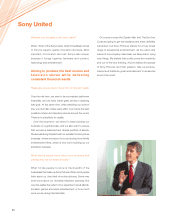
Sony 2007 Annual Report Download - page 30
Download and view the complete annual report
Please find page 30 of the 2007 Sony annual report below. You can navigate through the pages in the report by either clicking on the pages listed below, or by using the keyword search tool below to find specific information within the annual report.-
 1
1 -
2
-
3
-
4
-
5
-
6
-
7
-
8
-
9
-
10
-
11
-
12
-
13
-
14
-
15
-
16
-
17
-
18
-
19
-
 20
20 -
 21
21 -
 22
22 -
 23
23 -
 24
24 -
 25
25 -
 26
26 -
 27
27 -
 28
28 -
 29
29 -
 30
30 -
 31
31 -
 32
32 -
 33
33 -
 34
34 -
 35
35 -
 36
36 -
 37
37 -
 38
38 -
 39
39 -
 40
40 -
41
-
42
-
43
-
44
-
45
-
46
-
47
-
48
-
49
-
50
-
51
-
52
-
53
-
54
-
55
-
56
-
57
-
58
-
59
-
60
-
61
-
62
-
63
-
64
-
65
-
66
-
67
-
68
-
69
-
70
-
71
-
72
-
73
-
74
-
75
-
76
-
77
-
78
-
79
-
80
-
81
-
82
-
83
-
84
-
85
-
86
-
87
-
88
-
89
-
90
-
91
-
92
-
93
-
94
-
95
-
96
-
97
-
98
-
99
-
100
-
101
-
102
-
103
-
104
-
105
-
106
-
107
-
108
-
109
-
110
-
111
-
112
-
113
-
114
-
115
-
116
-
117
 |
 |

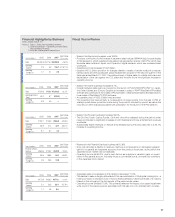
2005 2006 2007 2007/2006
(Yen in billions)
(Percent change)
Sales
¥733.7 ¥745.9 ¥966.3 +29.5%
Operating
income
63.9 27.4 42.7 +55.7%
Operating
margin (%)
8.7 3.7 4.4
2005 2006 2007 2007/2006
(Yen in billions)
(Percent change)
Financial services
revenue
¥560.6 ¥743.2 ¥649.3 –12.6%
Operating
income
55.5 188.3 84.1 –55.3%
Operating
margin (%)
9.9 25.3 13.0
2005 2006 2007 2007/2006
(Yen in billions)
(Percent change)
Sales
¥470.9 ¥426.0 ¥377.6 –11.4%
Operating
income
5.1 20.5 32.4 +57.9%
Operating
margin (%)
1.1 4.8 8.6
2005 2006 2007 2007/2006
(Yen in billions)
(Percent change)
Sales
¥729.8 ¥958.6 ¥1,016.8.+6.1%
Operating income
(loss)
43.2 8.7 (232.3.)—
Operating
margin (%)
5.9 0.9 —
2005 2006 2007 2007/2006
(Yen in billions)
(Percent change)
Sales
¥5,094.5 ¥5,176.4 ¥6,050.5 +16.9%
Operating
income
2.9 6.9 156.7 +2,167.4%
Operating
margin (%)
0.1 0.1 2.6
27
•Sales in the Game business increased 6.1%.
•Overall hardware sales were up, buoyed by the launch of PLAYSTATION®3 (PS3™) in Japan,
the United States and Europe. Despite an increase in sales of PSP® (PlayStation®Portable)
software and contributions from sales of PS3 software, overall software sales decreased due to
lower sales of PlayStation®2 (PS2) software.
•An operating loss of ¥232.3 billion was recorded.
•The operating loss was primarily a consequence of losses arising from the sale of PS3 at
strategic prices below production costs during the product’s introductory period, as well as the
recording of other charges associated with preparation for the launch of the PS3 platform.
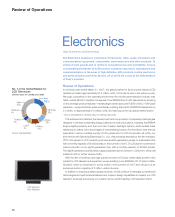
•Sales in the Electronics business rose 16.9%.
•Products contributing to the increase in segment sales included BRAVIA liquid crystal display
(LCD) televisions, which registered brisk sales in all geographic regions; VAIO PCs, which saw
favorable sales outside of Japan; and Cyber-shot digital cameras, which saw increased sales
worldwide.
•Operating income increased ¥149.8 billion.
•Despite a ¥51.2 billion provision for charges related to recalls of certain notebook computer
battery packs and the subsequent global replacement program in the second quarter of the
fiscal year ended March 31, 2007, the positive impact of higher sales to outside customers and
depreciation of the yen against the U.S. dollar and the euro drove the significant increase in
operating income.
Fiscal Year in ReviewFinancial Highlights by Business
(Years ended March 31)
Notes: 1. Sales = Sales and operating revenue
2. Operating margin = Operating income/Sales
and operating revenue
3. Includes intersegment transactions
•Sales in the Pictures business increased 29.5%.
•The Da Vinci Code, Casino Royale, Click and other films released during the period under
review contributed to significant increases in both theatrical and home entertainment revenues
worldwide.
•Substantially higher revenues on feature films released during the period also led to a 55.7%
increase in operating income.
•Revenue in the Financial Services business fell 12.6%.
•Sony Life recorded a decline in revenue, mainly as a consequence of decreased valuation
gains in its general and separate accounts from the previous fiscal year, during which the
Japanese stock market rose considerably.
•Operating income fell 55.3%, due to such factors as a decline in valuation gains on invest-
ments in the general account, including those on convertible bonds, prompted by conditions
in the Japanese stock market.
•Aggregate sales of businesses in this category decreased 11.4%.
•The decline in sales is largely attributable to the deconsolidation of StylingLife Holdings Inc., a
holding company comprised of six of Sony’s retail businesses, following the sale of a majority
interest in the company in the first quarter of the period under review.
•Operating income climbed 57.9%. This primarily reflected the impact of an asset impairment
write-down in the previous period associated with the sale of a U.S. entertainment complex.